My recent work has focused on seasonality of the gold price (Mercenary Musings: October 19; October 26; November 23). Today, I present new research covering a 20-year time frame from 1996- 2015 that includes a 12-year bull market for gold from 2001-2012 bracketed by bear markets in the late 1990s and mid-2010s.
In a series of normalized charts, I will show that regardless of overall year-over-year bull or bear market conditions, there are predictable intra-year trends in the gold price.
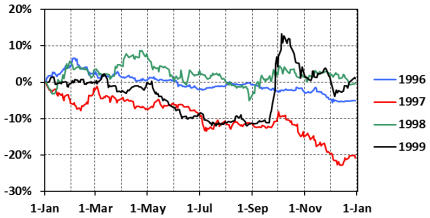
The first series of charts shows the percentage change in the daily gold price normalized to January 1 for each year from 1996 to 2015. Please note that all gold prices are London afternoon close: