

North American equity markets are believed to have reached an intermediate low on June 4th. However, macro and micro events (e.g second quarter reports) are expected to dampen enthusiasm for equities until the second half of July. Look for lots of volatility between now and then. This is typical of a market that is developing a base building pattern prior to an important intermediate move on the upside. Now is the time to do your homework on markets and sectors that are top purchase candidates after the base building period is complete.
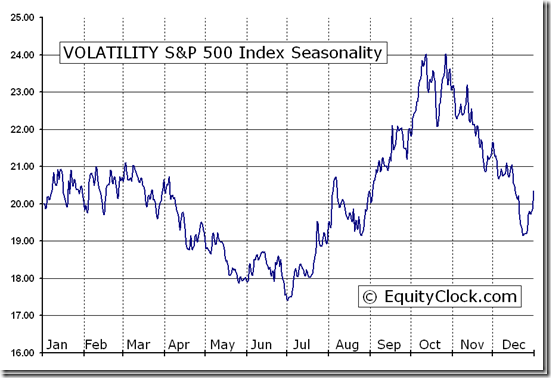
From Equity Clock: Its about to get Interesting – VOLATILITY S&P 500 Index (^VIX) Seasonal Chart
The spectacular response in equity and currency markets to news from Europe on Friday about a possible resolution of Europe’s credit crisis had a significant impact on short term technical indicators. Many markets and sectors at least moved above their 20 day moving average.
Significance of the Eurozone agreement is yet to be revealed. The two page document is the starting point for a plan. The devil is in the details.
Macro events will continue to impact equity markets this week. International events that could impact markets this week include China’s PMI on Sunday night, PMI indices from Switzerland, Italy, France, Germany, the United Kingdom and the Eurozone on Monday, Merkel and Monti meeting on Wednesday and Bank of England and Eurozone central bank interest rate announcements on Thursday.
Intermediate technical indicators improved, but were surprisingly muted. Many equity indices moved to the high end of their recent trading range, but failed to break above those levels. Above these levels lies a band of resistance. Tests of the band of resistance are expected to happen early this week.
Economic news this week is expected to confirm that economic growth in the U.S. continues to slow. The focus is on the employment report on Friday.
Earnings news is not a factor this week. However, the frequency of negative guidance prior to release of second quarter results has escalated and responses to negative guidance has been substantial. Analysts continue to lower consensus second quarter revenue and earnings estimates, sighting slowdowns in Europe and China and the negative impact of currency translation. Despite a year-over-year earnings gain of 33% by Apple, the largest S&P 500 company, S&P 500 companies are expected to report a year-over-year earnings decline of 0.7%.
Seasonal influences early in July are positive during the U.S. Independence day holiday and surrounding days. Main reason for strength is quarter-end money flows and positive anticipation of second quarter results. The former likely will happen, but the latter likely will not.
Cash on the sidelines remains substantial, but is unlikely to be invested until the market determines who will become the next U.S. President.
North American equity markets have a history of moving higher during the second half of a U.S. Presidential election year.
Volumes will be lighter than usual this week due to statutory holidays.
The S&P 500 Index gained 27.14 points (2.03%) last week with all of the gain occurring on Friday. Intermediate trend is down. The Index is testing the top of an eight week trading range between 1,266.74 and 1,363.46. The Index remains above its 20 and 200 day moving averages and moved above its 50 day moving average on Friday. Short term momentum indicators are neutral.

The TSX Composite Index gained 161.02 points (1.41%) last week. Intermediate trend is down. Seven week trading range is between 11,209.55 and 11,824.61. The Index remains below their 50 and 200 day moving averages, but moved above its 20 day moving average on Friday. Short term momentum indicators are neutral. Strength relative to the S&P 500 Index has returned to negative from a brief period at neutral.

Crude Oil gained $4.84 per barrel (6.05%) last week. Intermediate trend is down. Crude remained below its 50 and 200 day moving averages, but moved above its 20 day moving average on Friday. Short term momentum indicators are recovering from oversold levels. Strength relative to the S&P 500 Index is negative, but showing early signs of change.

Gold gained $26.00 per ounce (1.65%) last week. More than the week’s gain was recorded on Friday. Intermediate trend is down. Seven week trading range is between $1,526.70 and $1,642.40. Gold remained below its 200 day moving average and closed just below its 20 and 50 day moving averages. Short term momentum indicators turned upward from oversold levels on Friday. Strength relative to the S&P 500 Index is neutral/slightly positive.

Go HERE for more of Don’s Vialoux’s Monday analysis of 45 Market Charts


