

The Bottom Line
Equity markets on both sides of the border have had a good ride since their lows on June 4th. Now they are showing short and intermediate technical signs of an intermediate peak. It’s time to take profits in selected seasonal trades such as agriculture and leisure & entertainment. Other seasonal trades such as energy and gold have additional intermediate upside potential, but no longer are buy candidates. A cautious stance appears appropriate until the second half of October when upside opportunities are expected to re-appear.
Economic News This Week
The June Case/Shiller 20 City Home Price Index to be released on Tuesday at 9:00 AM EDT is expected to improve on a year-over-year basis from -0.7% to -0.3%.
The August Consumer Confidence Index to be released at 10:00 AM EDT on Tuesday is expected to slip to 65.5 from 65.9.
The Fed Beige Book is scheduled to be released at 2:00 PM EDT on Wednesday.
U.S. second quarter revised real annualized GDP to be released at 8:30 AM EDT on Wednesday is expected to be revised upward to 1.7% from 1.5%.
July Personal Income to be released at 8:30 AM EDT on Thursday is expected to increase 0.3% versus a 0.5% gain in June. July Personal Spending is expected to increase 0.5% versus no change in June.
Weekly Initial Jobless Claims to be released at 8:30 AM EDT on Thursday are expected to slip to 370,000 from 372,000 last week.
Canada’s June GDP to be released at 8:30 AM EDT on Friday is expected to slip to 1.6% on a year-over-year basis versus growth at 1.9% rate.
The August Chicago Purchasing Manager’s Index to be released at 9.45 AM EDT on Friday is expected to slip to 53.5 from 53.7 in July.
The August Michigan Consumer Sentiment Index to be released at 9:55 AM EDT on Friday is expected to remain unchanged at 73.6.
Other Issues
The VIX Index jumped 1.73 (12.9%) last week. Short term momentum indicators are trending higher from oversold levels.

The earnings focus this week is on the Canadian banks. Look for modest gains on a year-over-year basis. At least two of the banks are expected to increase their dividend.
Economic reports this week are expected to have a mildly negative impact on equity markets (Consumer confidence, Chicago PMI, Michigan consumer sentiment).
Macro news heats up this week. The focus is on Bernanke’s speech next Friday at 10:00 AM EDT and Draghi’s speech on Saturday morning. Other events to watch include Eurozone consumer confidence on Thursday and China’s PMI next Saturday (estimated to fall from 50.1 to 49.8).
Short and intermediate technical indicators for most equity markets and sectors are overbought and are showing signs of rolling over. Mary Ann Bartels, Merrill Lynch’s technical analyst predicted downside risk by the S&P 500 between now and the end of September at 8-10%. Following is a link from CNBC to her video: http://www.cnbc.com/id/48756751
North American equity markets have a history of moving lower from the beginning of September to mid-October during a U.S. Presidential election year (particularly when polls show a close race. Thereafter, equity markets move higher regardless of who wins.
September is the weakest month of the year for North American equity markets. This is the month that analysts review their estimates for the current year, realize their estimates are too high and revise them accordingly. History is about to repeat.
Other issues that could impact equity markets include Hurricane Isaac, the Republican convention and increasing media comments about the possibility of Israel attacking Iran before the Presidential election.
Cash on the sidelines on both sides of the border is substantial and growing. Bank of Canada’s Mark Carney highlighted the situation in Canada last week. However, political uncertainties (including the Fiscal Cliff) preclude major commitments by investors and corporations before the Presidential election.
Equity Trends
The S&P 500 Index slipped 7.03 points (0.50%) last week. Intermediate trend changed from neutral to up when the Index briefly moved above resistance at 1,422.38. However, the Index also recorded a bearish key reversal last Tuesday implying the likelihood of at least a short term peak. The Index remains above its 50 and 200 day moving averages, but is testing its 20 day moving average. Short term momentum indicators have rolled over from overbought levels and are trending down.
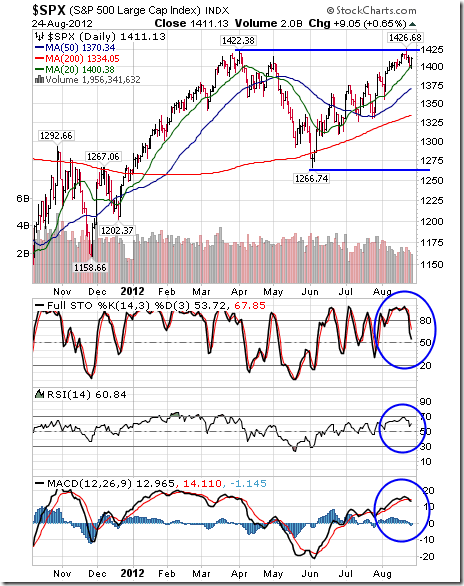
Percent of S&P 500 stocks trading above their 50 day moving average fell last week to 73.40% from 81.40%. Percent is intermediate overbought and has rolled over from above the 80% level, a frequent indicator that the Index has passed a short term peak.

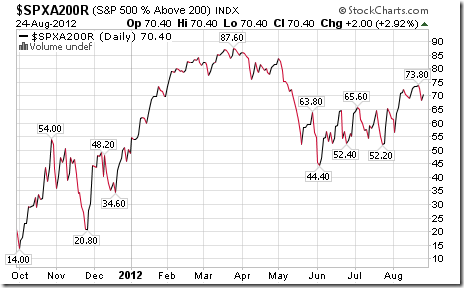
Percent of S&P 500 stocks trading above their 200 day moving average slipped last week to 70.40% from73.40%. Percent is intermediate overbought and showing early sign of peaking
The ratio of S&P 500 stocks in an uptrend to a downtrend (i.e. the Up/Down ratio) slipped last week to (279/127=) 2.20 from 2.26. Twenty three stocks broke resistance and 24 stocks broke support (mostly utility stocks).
Bullish Percent Index for S&P 500 stocks increased last week to 70.40% from 70.00% and remained above its 15 day moving average. The Index is intermediate overbought.

The Up/Down ratio for TSX Composite stocks increased last week to (151/73=) 2.07 from 1.72. Twenty stocks broke resistance and two stocks broke support.
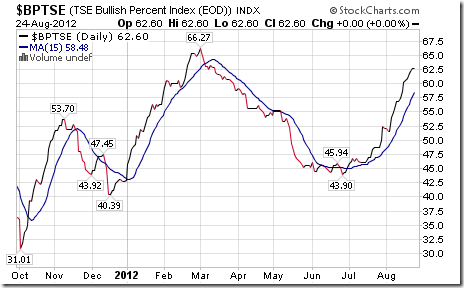
Bullish Percent Index for TSX Composite stocks increased last week to 62.60% from 60.57% and remained above its 15 day moving average. The Index remains intermediate overbought.
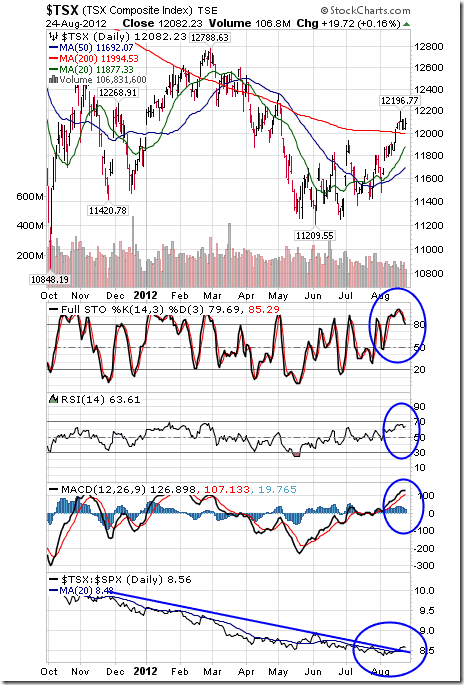
The TSX Composite Index slipped 7.66 points (0.06%) last week. Intermediate trend is up. The Index remains above its 20, 50 and 200 day moving averages. Short term momentum indicators are overbought and showing early signs of rolling over. Strength relative to the S&P500 Index has been negative, but is showing early signs of change.
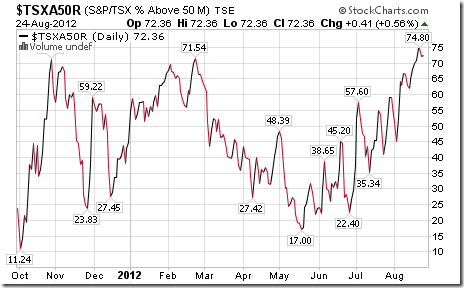
Percent of TSX stocks trading above their 50 day moving average increased last week to 72.36% from 69.92%. Percent is intermediate overbought above the 70% level. Peaks from above the 70% level normally lead to at least a short term correction by the Index.
Percent of TSX stocks trading above their 200 day moving average increased last week to 51.63% from 48.37%. Percent is intermediate overbought.
…..for 40 more charts and commentary go HERE
Don Vialoux
Don Vialoux has 37 years of experience in the Investment Industry. He is a past president of the Canadian Society of Technical Analysts (www.csta.org) and a former technical analyst at RBC Investments. Don earned his Chartered Market Technician (CMT) designation from the Market Technician Association in 1995. His CMT paper entitled “Seasonality in Canadian Equity Markets” was published in the Spring-Summer 1996 edition of the MTA Journal. Don also has extensive experience with Exchange Traded Funds (also know as Index Participation Units) as well as conservative option strategies. In 1990 he wrote a report that was released in the International Federation of Technical Analyst Journal entitled “Profiting from a Combination of Technical and Fundamental Analysis”. The report introduced ” The Eight Phases of the Stock Market Cycle”, an investment concept that continues to identify profitable entry and exit points for North American equity markets. He is currently a member of the Toronto Society of Fundamental Analyst’s Derivatives Committee. Now he is the author of a daily letter on equity markets available free on the internet. The reports can be accessed daily right here at www.dvtechtalk.com.
Impossible! That’s what institutional investors say about “Timing the Market”. Mr. Vialoux will explain that, indeed, it can be done with the appropriate analysis. He also will explain why timing the market will be important during the next decade. Buy and Hold strategies are not working anymore; Investors are looking for alternatives. Mr. Vialoux will demonstrate four techniques that can be used to time intermediate stock market swings lasting 5-15 months. The preferred investment vehicles for investing in intermediate stock market swings are Exchange Traded Funds.
Security positions held or not held by Mr. Vialoux will be indicated at the end of each Tech Talk report.
Comments in Tech Talk reports are the opinion of Mr. Vialoux. They are based on technical, fundamental and/or seasonal data that is believed to be accurate. The comments are free. Mr. Vialoux receives no remuneration from any source for these services. Comments should not be considered as advice to buy or to sell a security. Investors, who respond to comments in Tech Talk, are financially responsible for their own transactions.
All charts in Tech Talk come from StockCharts.com. Stock Charts can be accessed at no cost throughwww.stockcharts.com.


