

Most equity markets in the world and major sectors are recovering from oversold lows set on November 16th. Selected sectors with favourable seasonal influences already are outperforming. Equity markets are set up for continuation of last week’s recovery rally that likely will last until at least Inauguration Day.
Short term momentum indicators are recovering from oversold levels and are trending up.
Currency trends could have a significant influence on equity markets this week. The U.S. Dollar virtually collapsed on Friday, but on relatively thin trading. If the fall holds early this week, it will confirm a change in momentum by the U.S. Dollar from up to down. A weaker U.S. Dollar is bullish for equity markets.
North American equity markets have a history of moving higher from U.S. Thanksgiving Day to the end of the year. A study by CNBC revealed that, on average since 1928, the Dow Jones Industrial Average has gained an average of 1.8% during this period. The trade has been profitable 80% of the time. In addition, the last week in November also has a history of outperformance by U.S. equity markets.
Europe’s decision on Greece also could be a market-mover. A decision is expected to be reached as early as today.
Economic news this week is expected to encourage equity markets (home prices, consumer confidence, Q3 GDP, Chicago PMI) with the exception of the Durable Goods Orders report
Sectors that normally show positive seasonality at this time of year continue to outperform the market including agriculture, forest products, industrials, home builders, semiconductors, biotech, China, Europe and the TSX Composite.
Every World Major Market Index Below:
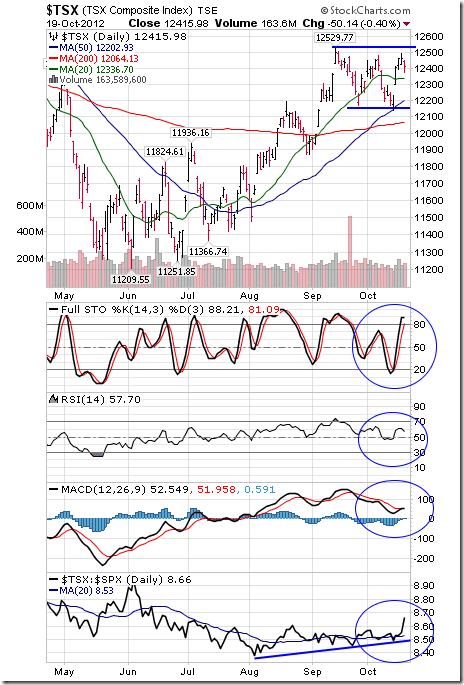
The TSX Composite Index gained 335.52 points (2.82%) last week. Intermediate trend is down. Support is forming at 11,761.34. The Index moved above its 200 day moving average and closed above its 20 day moving average on Friday. Short term momentum indicators are recovering from oversold levels. Strength relative to the S&P 500 Index has changed from positive to at least neutral.
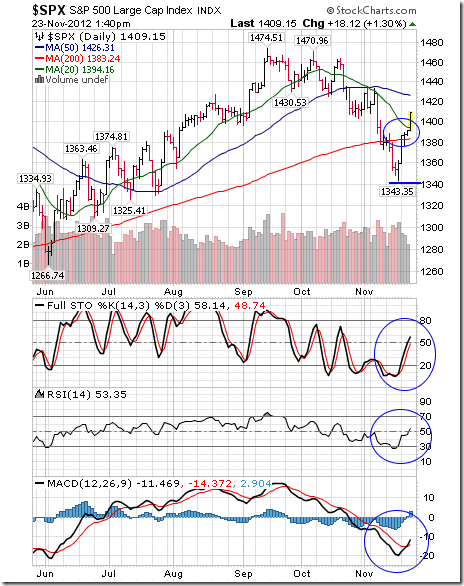
The S&P 500 Index gained 49.27 points (3.62%) last week. Intermediate trend is down. Support is forming at 1,343.35. The Index moved above its 20 and 200 day moving averages on Friday. Short term momentum indicators have recovered from oversold levels.
The Australia All Ordinaries Composite Index gained 72.32 points (1.66%) last week. Intermediate trend is up. Support is forming at 4,355.90. The Index remains above its 200 day moving average and below its 20 and 50 day moving averages. Short term momentum indicators are recovering from oversold levels. Strength relative to the S&P 500 Index has changed from positive to at least neutral.

The Nikkei Average gained 342.64 points (3.80%) last week. Intermediate trend changed from neutral to up on a break on Thursday above resistance at 9,288.53 (Japanese equity markets were closed on Friday). Short term momentum indicators are trending up. Strength relative to the S&P 500 Index remains positive.

Europe 350 iShares gained $1.93 (5.42%) last week. Intermediate trend is down. Support is forming at $35.34. Resistance is at $38.55. Units moved above their 20 and 50 day moving averages on Friday. Short term momentum indicators are recovering from oversold levels. Strength relative to the S&P 500 Index remains positive.

The Shanghai Composite Index added 0.89 (0.04%) last week. Intermediate trend is down. The Index briefly broke support at 1,999.48 before recovering. The Index remains below its 20, 50 and 200 day moving averages. Short term momentum indicators are oversold and showing early signs of bottoming. Strength relative to the S&P 500 Index changed from positive to neutral.

The Athens Index advanced 56.31 points (7.12%) last week. Intermediate trend is neutral. Support is forming at 758.03 and resistance has formed at 910.99. The Index remains above its 200 day moving average and moved above its 20 and 50 day moving averages. Short term momentum indicators are trending up. Strength relative to the S&P 500 Index remains positive.

So many more charts & comments HERE


