

The Bottom Line
Most equity markets around the world and most sectors remain under significant technical pressure and signs of a bottom are tentative at best. Meanwhile, most equity markets and sectors are substantially oversold and set up for a strong recovery rally triggered partially by short covering. Favourable seasonal influences in selected sectors are apparent despite the decline by broadly based equity indices. Equity markets are setting up for a recovery rally on a Fiscal Cliff agreement that likely will last until at least Inauguration Day in the third week in January.
Other Factors
Volume in equity markets is expected to be significantly lower than average this week as the U.S. Thanksgiving holiday on Thursday approaches.
Historically, the strongest two consecutive days for stock market performance during the year are the day before U.S. Thanksgiving and a day after U.S. Thanksgiving. Average return per period for the S&P 500 Index during the past 61 years is 0.80%
Earnings reports and economic news this week are not expected to have a significant impact on equity markets.
Political focus is on the Fiscal Cliff. A meeting with the President and Congressional leaders on Friday concluded with encouraging comments about a possible agreement. However, no agreement will be reached this week. The President is in Asia and Congress is closed for the Thanksgiving holiday. The media’s count-down to the Fiscal Cliff is 43 days. However, with Congress on holidays today and on holidays in the last two weeks in December and with any agreement required to be scored by the OBC (Office of the Budget Committee), actual number of days available for negotiation is closer to 21 days.
Short term momentum indicators are deeply oversold and showed encouraging signs on Friday of bottoming.
Macro events outside of North America will impact North American equity markets. The escalating conflict between Israel and Gaza has grabbed the world’s attention. The Eurozone group of 17 nations is meeting today. The Euro summit of 27 nations will meet on Thursday and Friday.
The spending of large cash positions held by corporations on both sides of the border have started to move in a small way (e.g. Sherwin Williams purchasing a Mexican companies, several companies announcing fourth quarter ex dividend dates before the end of the year instead or early next year, share buy backs). However, most corporations are waiting for results of negotiations on the Fiscal Cliff before making major changes.
Long term seasonal influences on equity markets are positive from October 28th to May 5th.
Equity markets in the month of November have been strongest in the second half of the month.
Despite weakness in broadly based U.S. equity indices, favourable seasonal influences continue to show through (but in an unfavourable way). Sectors such as agriculture, forest products, transportation, industrials, home builders, semiconductors, China, Europe and the TSX Composite continue to outperform the S&P 500 on an intermediate basis (but by declining less than the S&P 500).
Key Indexes/Markets
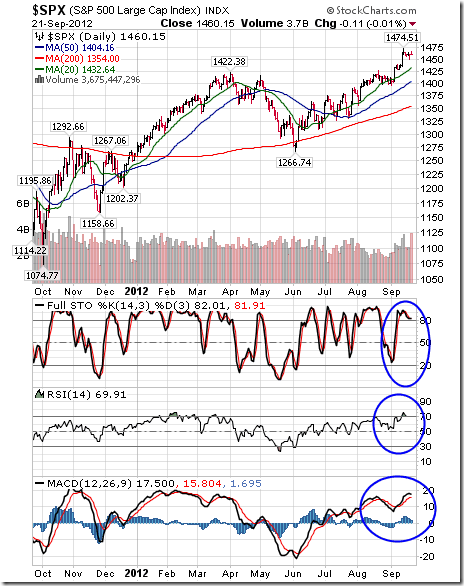
The S&P 500 Index dropped 19.97 points (1.45%) last week. Intermediate trend is down. The Index remains below its 20 and 50 day moving averages and fell below its 200 day moving average. Short term momentum indicators are oversold, but have yet to show signs of bottoming.
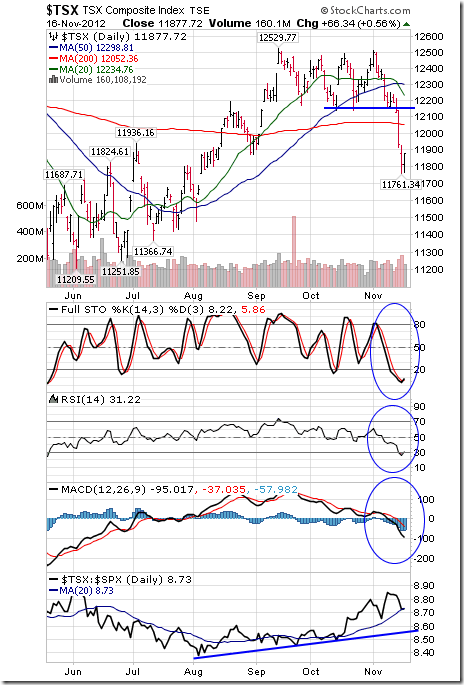
The TSX Composite Index fell 319.08 points (2.62%) last week. Intermediate trend changed from neutral to down on a break below support at 12,137.18. The Index remains below its 20 and 50 day moving averages and fell below its 200 day moving average. Short term momentum indicators are oversold, but have yet to show signs of bottoming. Strength relative to the S&P 500 Index remains positive.
The U.S. Dollar gained another 0.23 (0.28%) last week. Intermediate trend is up. The Index remains above its 20, 50 and 200 day moving averages. Short term momentum indicators are overbought, but have yet to show signs of peaking.

Crude Oil added $1.01 per barrel (1.17%) last week. Intermediate trend is down. Support is forming at $84.05 per barrel. Crude oil moved above its 20 day moving average on Friday, but remains below its 50 and 200 day moving averages. Short term momentum indicators are recovering from oversold levels. Strength relative to the S&P 500 Index has turned positive.

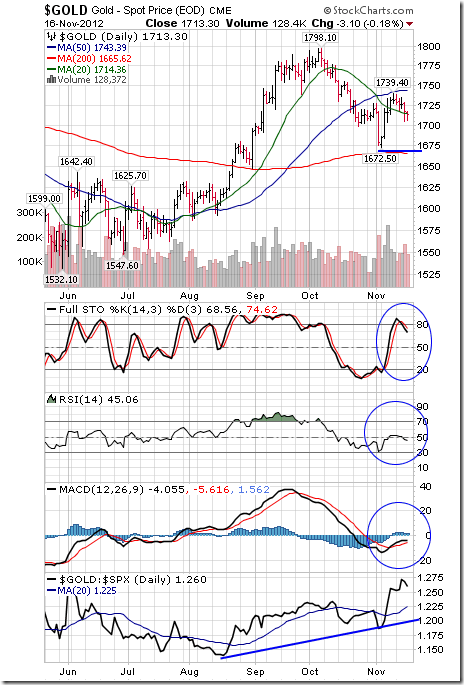
Gold slipped $17.10 per ounce (0.99%) last week, triggered by continuing strength in the U.S. Dollar Index. Intermediate trend is neutral. Support is at $1,672.50 and resistance is forming at $1,739.40. Gold remains below its 50 day moving average and fell below its 20 day moving average on Friday. Short term momentum indicators are neutral. Strength relative to the S&P 500 Index remains positive.
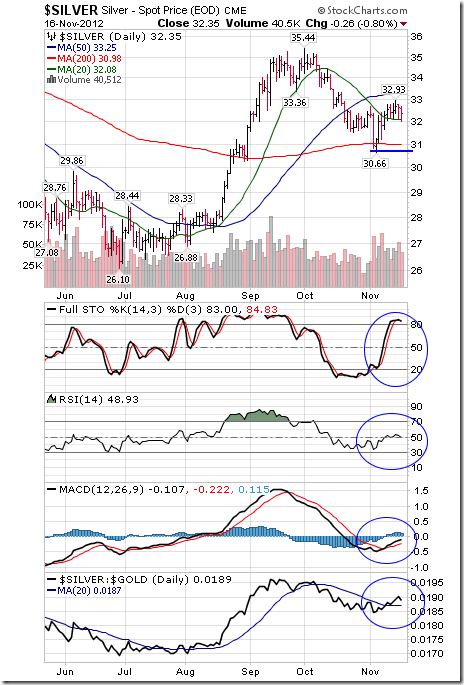
Silver slipped $0.18 (0.55%) last week. Intermediate trend is neutral. Support is at $30.66 and resistance is forming at $32.93. Silver trades above its 20 and 200 day moving averages and below its 50 day moving average. Short term momentum indicators are trending up. Strength relative to gold has turned positive.
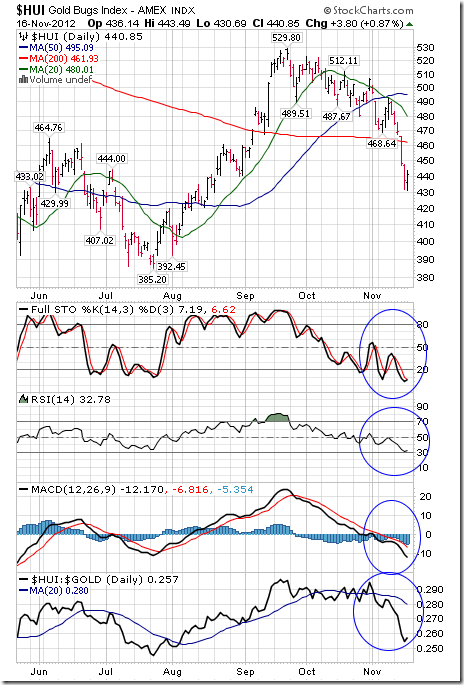
The AMEX Gold Bug Index dropped 40.36 points (8.84%) last week. Intermediate trend is down. The Index remains below its 20 and 50 day moving averages and fell below its 200 day moving average. Short term momentum indicators are oversold, but have yet to show signs of bottoming. Strength relative to gold bullion remains negative.
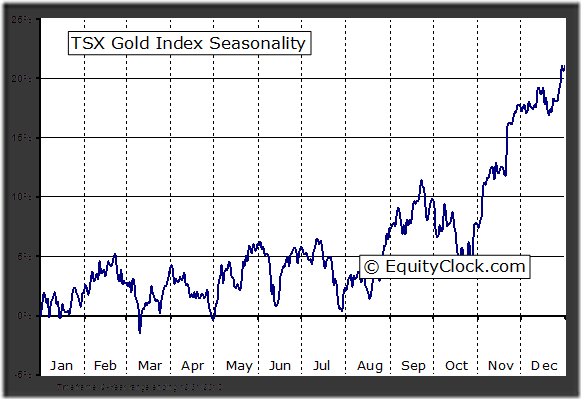
The TSX Metals & Mining Index dropped 44.47 points (4.66%) last week. Intermediate trend is neutral following a break below support at 910.32. The Index fell below its 20 and 50 day moving averages. Short term momentum indicators are trending down. Strength relative to the S&P 500 Index remains positive despite the loss last week. Seasonal influences start to become positive at this time of year.
…..many more charts & comments HERE on Don’s Great Monday Report


