

The Bottom Line
The entry point for the seasonal trade this year is here. The TSX Composite Index reached a low of 12,132 on October 15th. The low for the S&P 500 Index and Dow Jones Industrial Average has yet to be confirmed, but both indices showed evidence on Friday that they are trying to bounce from near key support levels. Downside risk is limited and upside potential into early next year is above average. Average gain during an election year by the S&P 500 Index from November 1st to February 1st is 5.0%. Preferred strategy is to accumulate equities and Exchange Traded Funds with favourable seasonality at this time of year that already are showing technical signs of performance or outperformance relative to the market (S&P 500 for U.S. markets and TSX Composite for Canadian markets). Sectors include agriculture, forest products, transportation, industrials, steel, consumer discretionary, semiconductors, home builders, China and Europe.
“For seasonal traders, this Monday is the day to buy stocks”.
Following is full text of Don Vialoux’s article in the Globe & Mail
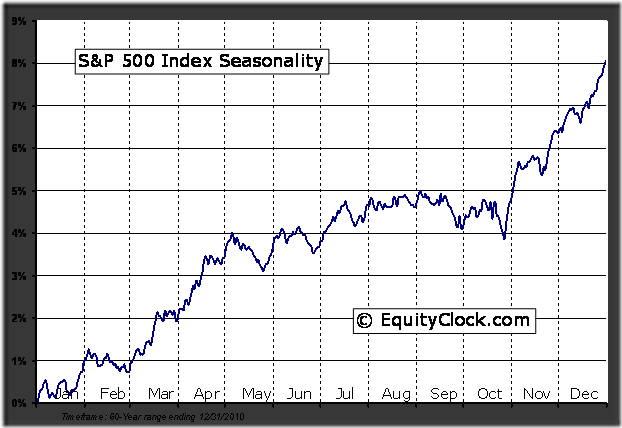
The best time during the past 61 years to enter North American equity markets has been at the opening of trade on October 28th. This year, the optimal date is the opening of trade on Monday October 29th. How does the entry point look this year?
Thackray’s 2012 Investor’s Guide notes that the best period to own U.S. equities during the past 61 years has been from October 28th to May 5th. A $10,000 investment in the S&P 500 Index purchased each year on October 28th since 1950 and sold each year on May 5th during the past 60 periods increased in value to $1,057,851 by May 5th 2011. The trade was profitable in 53 of the past 61 periods. In contrast, a $10,000 investment in the S&P 500 Index purchased each year on May 6th and sold each year on October 27th fell in value to $6,862. Calculations did not include dividends or commission costs.
The best period to own Canadian equities is identical. Data for the past 34 years shows that a $10,000 investment in the TSX Composite Index purchased each year on October 28th since 1977 and sold each year on May 5th increased in value to $200,778 by May 5th 2011.The trade was profitable in 29 of the past 35 periods. In contrast, a $10,000 investment purchased each year on May 6th and sold on October 27th fell in value to $6,674.
The main reason for the period of seasonal strength is a response by equity markets to a series of positive annual recurring events from late October to early May. Annual recurring events include transactions for tax purposes, anticipation of quarterly and annual corporate reports, the timing of analyst opinion changes, key economic reports, and special holidays, including the U.S. Thanksgiving holiday and the Christmas holiday.
The beginning of the period of seasonal strength at the end of October typically happens just after a majority of S&P 500 companies have reported third quarter results. Prior to the end of October during the third quarter earnings report period, U.S. equity markets have a history of exceptional volatility. This year was no exception.
The October 28th to May 5th favourable period of investment is best known as the “Buy when it snows, sell when it goes” strategy. By coincidence, the phrase is particularly relevant this year. Calgary experienced its first snow storm yesterday.
Negative return indicated in the data during the May 6th to October 27th periods does not imply a “Sell in May, go away” strategy. “Sell in May and go away” is a myth. The S&P 500 Index has gained in 38 out of the past 61 periods and the TSX Composite has advanced in 20 of the past 35 periods. However, gains were modest and the losses were higher relative to the period of seasonal strength. The May 6th to October 27th periods is plagued by higher volatility and fewer annual recurring events that influence equity markets.
The October 28th entry date for the annual seasonal trade is an average date. The optimal date to enter the trade each year is fine-tuned using short term momentum indicators. The optimal date normally occurs on the average date plus or minus three weeks. Last year, the optimal entry date was October 5th.
What about this October? Short term momentum indicators for the S&P 500 Index and TSX Composite Index already are oversold, but have yet to show signs of bottoming. A trigger recording a momentum buy signal is likely to occur during the next few days.
Year-end “window dressing” by U.S. mutual fund companies could have an impact on U.S. equity markets this year. Most major mutual fund companies have a fiscal year end on October 31st. Managers of these funds frequently add best performing equities prior to November 1st in order to “pretty up” their portfolio for unit holder reporting purposes. Net result is a positive bias in equity markets during the last four trading days of October.
Thackray’s 2012 Investor’s Guide notes that the last four trading days in October has recorded an exceptional return on investment in U.S. equity markets. Average return per period from 1950 to 2010 for the S&P 500 Index was 1.0 per cent. Moreover, the first three trading days in November have provided above average returns.
Given current short term oversold condition in the U.S. equity market, chances of a successful trade this year starting this Friday and continuing to November 5th are above average.
An opportunity to enter into North American equity markets at current or lower prices for a seasonal trade lasting until spring has arrived. A wide variety of Exchange Traded Funds are available that track major U.S. and Canadian equity indices.
Equity Trends
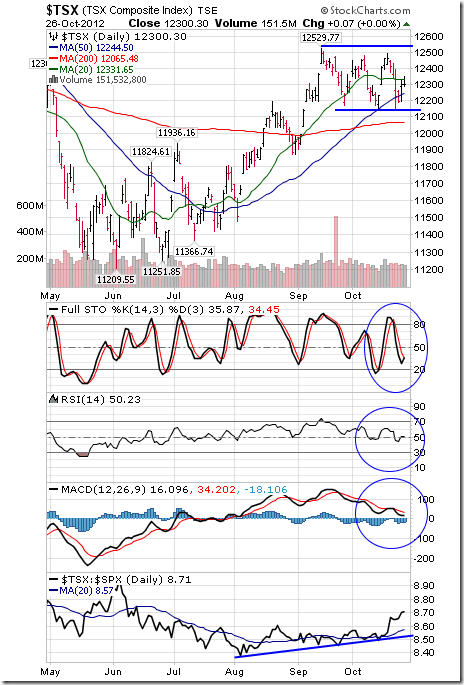
The TSX Composite Index dropped 115.68 points (0.93%) last week. Intermediate trend is neutral. Support is at 12,137.18 and resistance is 12,529.77. The Index remains above its 200 day moving average and moved back above its 50 day moving average on Thursday. Short term momentum indicators are neutral. Strength relative to the S&P 500 Index remains positive.
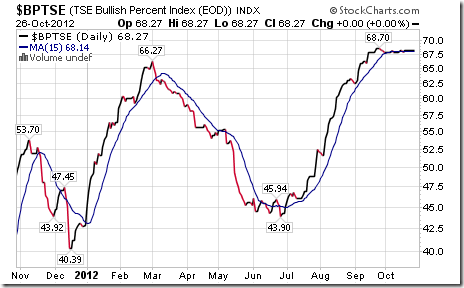
Bullish Percent Index for TSX Composite stocks was unchanged last week at 68.27% and remained above its 15 day moving average. The Index remains intermediate overbought.
Percent of TSX Composite stocks trading above their 50 day moving average fell last week to 49.00% from 57.83%. Percent continues to trend down.

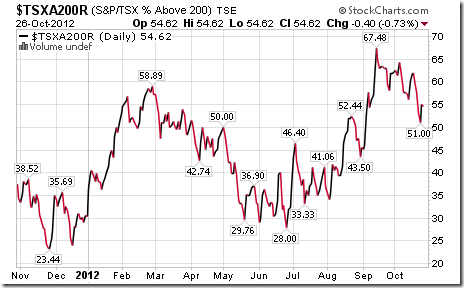
Percent of TSX Composite stocks trading above their 200 day moving average fell last week to 54.62% from 59.04%. Percent continues to trend down.
The S&P 500 Index fell 21.25 points (1.48%) last week. The Index has lost 4.25% from its September 14th high at 1,474.51. Intermediate trend is down. Support is at 1,396.56. The Index remains below its 20 and 50 day moving averages. Short term momentum indicators are oversold, but have yet to show signs of bottoming.
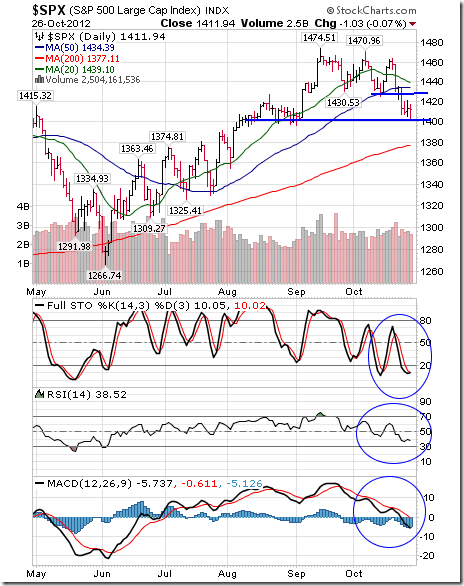
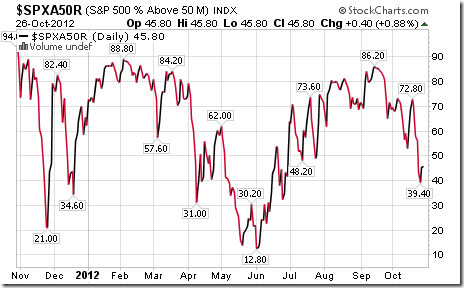
Percent of S&P 500 stocks trading above their 50 day moving average fell last week to 45.80% from 58.00%. Percent continues to trend down.
Percent of S&P 500 stocks trading above their 200 day moving average fell last week to 64.00% from 70.40%. Percent continues to trend down.

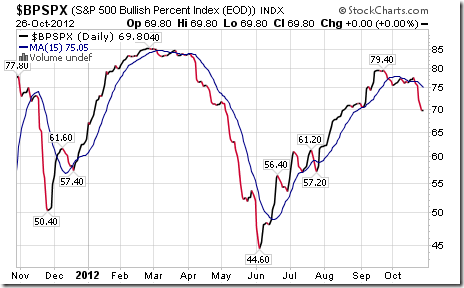
Bullish Percent Index for S&P 500 stocks fell last week to 69.80% from 76.20% and remains below its 15 day moving average. The Index remains intermediate overbought and trending down.
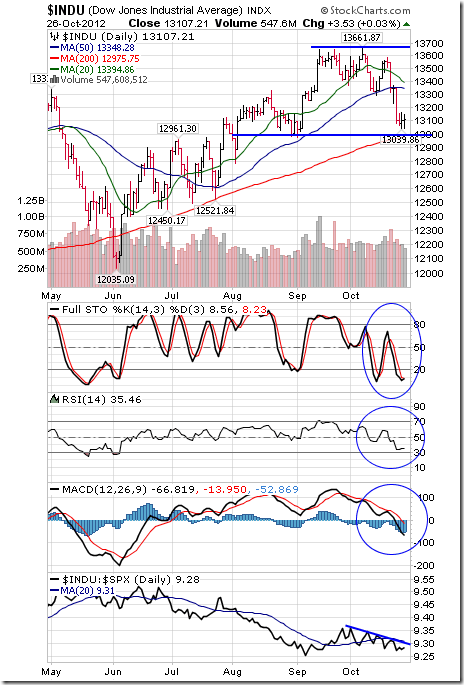
The Dow Jones Industrial Average fell 236.30 points (1.77%) last week. Intermediate trend changed from neutral to down on a break below support at 13,296.43. Next support is at 12,977.09. The Average remains below its 20 and 50 day moving averages. Short term momentum indicators are oversold, but have yet to show signs of bottoming. Strength relative to the S&P 500 Index has turned from neutral to negative.
…….read more including 45 charts and economic & earnings news this week in Don’s Monday Report HERE


