

Most equity markets in the world and major sectors currently are in intermediate uptrends. As the saying goes, “The trend is your friend”. Preferred strategy is to accumulate favoured sectors on weakness for an intermediate rally that is likely to last at least until Inauguration Day in the third week in January.
The Fiscal Cliff remains the top issue influencing equity markets. Most likely scenario is a resolution before the end of the year, but in two steps. The first step will handle issues with a deadline at the end of the year (e.g. tax rates on dividends and capital gains). The second step will focus on the “Grand Plan” that will include Tax Reform on the personal and corporate level as well as entitlements and the debt ceiling. Equity markets will respond favourably when the first step is announced (but not with a big upside move) because short term uncertainties are removed. The second step is by far the most important and is likely to create the greatest volatility in equity markets. Will Obama moved toward the middle of the political spectrum during the second step? If he does, confidence in the corporate community will be at least partially restored and large cash position will start to be employed in ways that will help the U.S. economy. On the other hand, if Obama maintains his current antagonistic attitude against capital enterprise, the large cash positions will be employed in other ways (e.g. share buy backs, employment of capital outside of the U.S.). Unfortunately, some corporations already are starting to choose to employ their large cash positions by issuing special dividends and by announcing share buy backs. The completion of the second step will determine the direction for equity markets in 2013.
Historically, the strongest three week period for North American equity markets is from December 15th to January 7th. According to Thackray’s 2012 Investor’s Guide, average gain during the period since 1950 was 2.0%. The gain by the NASDAQ Composite Index was better. Average gain per period since 1971 was 3.0%. As the book says, “Santa arrives early and leaves late”. One of the reasons for the Santa Claus rally is the end of tax loss selling pressures (particularly in the gold equity sector this year). Other reasons include upbeat reports released by the investment community predicting encouraging prospects for the next year, lower than average institutional volume and a buoyant mood by individual investors during the Christmas holiday period. This year, the first step toward resolution of the Fiscal Cliff provides an extra “kicker”.
Sectors with positive seasonality at this time of year continue to outperform the S&P 500 Index including Agriculture, forest product equities, lumber, industrials, semiconductors, biotech, Europe, base metals, silver equities, platinum and copper.
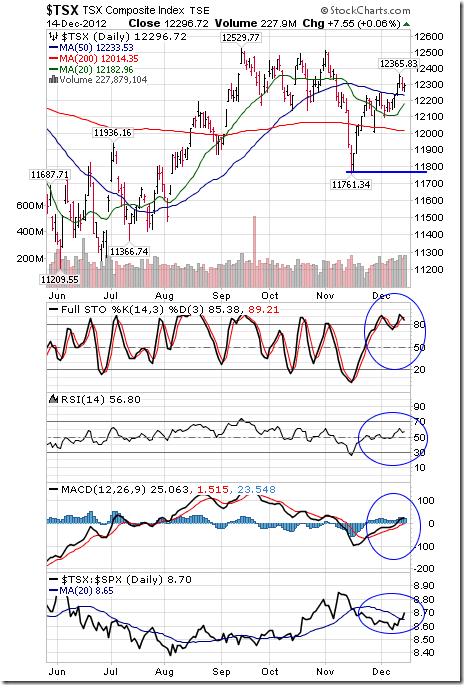
The TSX Composite Index added 137.05 points (1.13%) last week. Intermediate trend changed from down to up on a break above 12,252.27. The Index remained above its 20 and 200 day moving averages and moved above its 50 day moving average. Short term momentum indicators are overbought, but have yet to show signs of peaking. Strength relative to the S&P 500 Index has changed from negative to at least neutral.
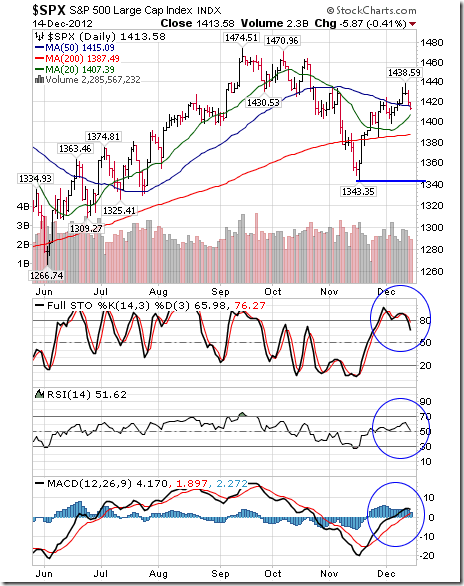
The S&P 500 Index fell 4.49 points (0.32%) last week. Intermediate trend changed from down to neutral on a move above 1,434.27. Next resistance is at 1,470.96. Support is at 1,343.35. The Index remains above its 20, 50 and 200 day moving averages. Short term momentum indicators are overbought and showing signs of rolling over.
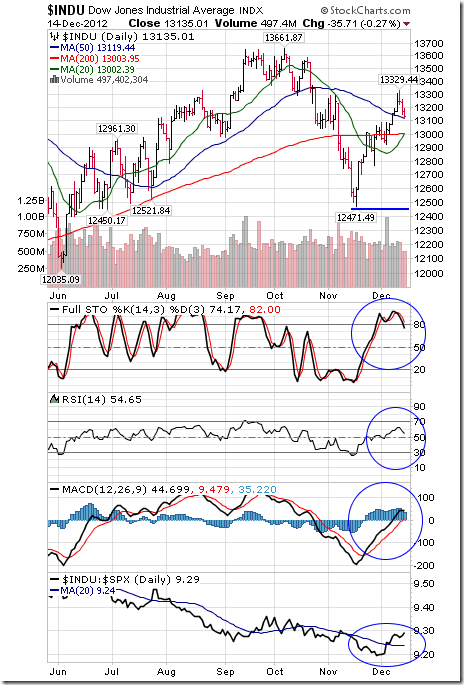
The Dow Jones Industrial Average slipped 20.12 points (0.15%) last week. Intermediate trend changed from down to neutral when the average moved above 13,290.75. Next resistance is at 13,661.87. Support is at 12,471.49. The Average remains above its 20, 50 and 200 day moving averages. Short term momentum indicators are overbought and showing early signs of rolling over. Strength relative to the S&P 500 Index is at least neutral and showing early signs of outperformance.
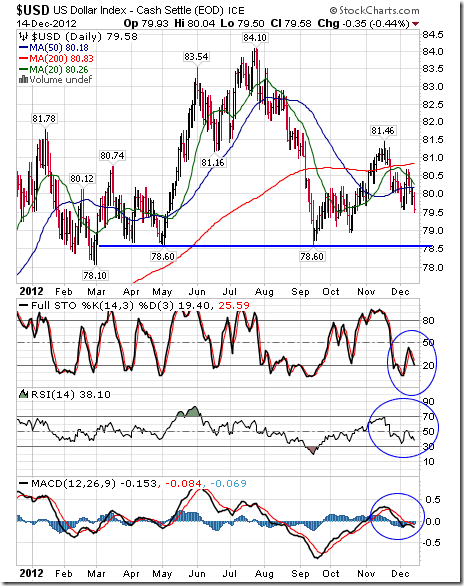
The U.S. Dollar virtually collapsed last week after Congress and the President failed to negotiate a deal on the Fiscal Cliff and after the Federal Reserve unofficially confirmed a Quantitative Easing Infinity program. The Index plunged 90.84 (1.04%). The Index remains below its 200 day moving average and fell below its 20 and 50 day moving averages. Short term momentum indicators are trending down. The Index completes a massive head and shoulders pattern on a break below 78.60.
Crude Oil added $0.73 per barrel (0.85%) last week. Intermediate trend is neutral. Support is at $84.05 and resistance is at $90.33. Response to the OPEC meeting was negligible. Crude remains below its 20, 50 and 200 day moving averages. Short term momentum indicators are trending down. Stochastics already are oversold. Strength relative to the S&P 500 Index remains negative.

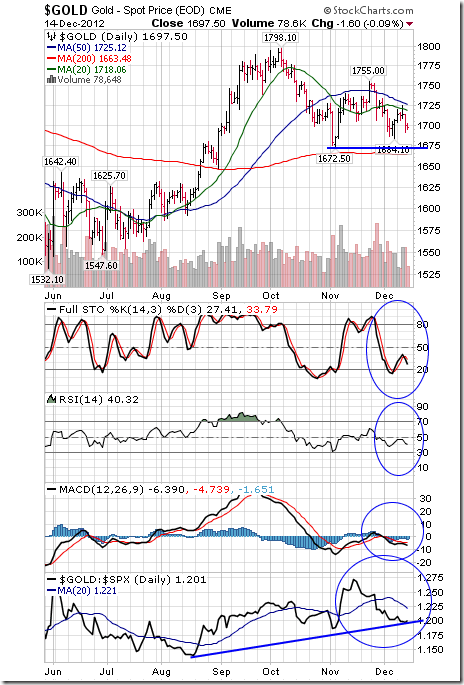
Gold slipped $7.70 per ounce (0.45%) last week despite weakness in the U.S. Dollar. Intermediate trend is neutral. Support is at $1,672.50 and resistance is at 1,755.00. Gold remains below its 20 and 50 day moving averages and above its 200 day moving average. Short term momentum indicators are mixed. Strength relative to the S&P 500 Index remains neutral.
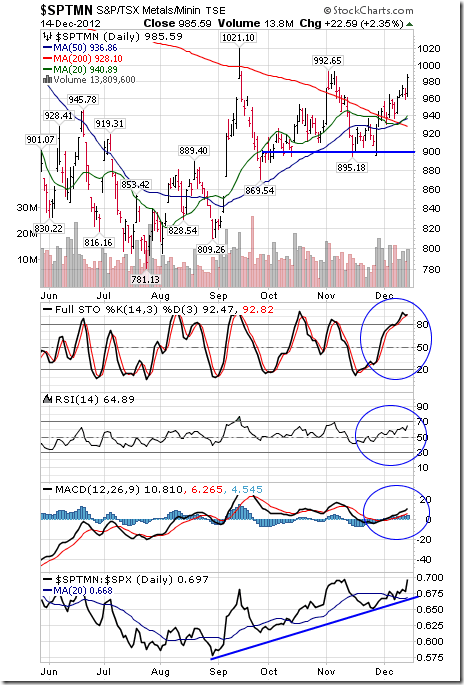
The TSX Global Metals and Mining Index jumped 42.73 points (4.53%) last week. Intermediate trend is neutral. The Index remains above its 20, 50 and 200 day moving averages. Short term momentum indicators are overbought, but have yet to show signs of peaking. Strength relative to the S&P 500 Index remains positive. ‘Tis the season!
…..much more (46 charts and analysis) HERE


