Today I am going to lay out the case of a major market top and how it fits into the geopolitical backdrop of today. We then profile the trade set-up to look for and finally I will forcefully remove your Rose Colored Glasses you have been wearing since January 2017.
In Barbara Tuchman’s “The Guns of August” she argues that August 1914 was when the Gilded Age died and the modern era actually began. The book opens with the famous depiction of Edward VII’s funeral in 1910 attended peacefully by all the kings of Europe. Never again would the body of world leaders be unified and cut from a similar cloth. The war ushered in a new world, not recognizable from the past. Not since that time have we witnessed such diplomatic folly as in the month of August 1914. Today we wonder are we witnessing a similar conflict between a super power and the client state of China which is an emerging super power? Could it unfold in a similar fashion?
Since May I have chronicled the topping process associated with a post bubble contraction. We have witnessed the following sequence:
1 The Gold-Silver ratio initially warning of an upcoming credit contraction in the future.
2. European stocks putting in a top in the traditional time window of May-June
3. USA stocks embarking on a final run for the roses, one last hurrah over the summer.
4. The Gold-Silver ratio signaling a confirmation of its original signal.
5. Yield curve flattening and credit spreads widening
6. Investor psychology embracing market top behaviors.
7. An initial crack in the US indexes in the time window of August or September.
The Topping Process
Over the summer we have watched the indexes relentlessly rise despite narrower breath. The FAANGs drove the NASDAQ and Boeing drove the Dow over the past 6 weeks. The DOW being a price weighted index, was inordinately influenced by Boeing, now a $240 stock. Boeing’s rise accounted for 75% of the DOW’s gain since the beginning of July. Strip Boeing out of the DOW and the index barely even rose… Same with the FAANG’s effect on the NASDAQ.
This of course is classic topping action. It masks the underlying exhaustion which has been occurring in individual issues. The exhaustion expressed itself in a lack of volatility. On August 8th the S&P 500 had gone 13 days in a row with less than a 0.3% fluctuation. This has never occurred since records have been kept since 1927. This compression then expressed itself with the VIX exploding over 80% in a raucous 3 day move.
Bearish market signals have been evident to the few who cared to interpret the charts. Let’s take a look at some of the flashing red flags available to all who care to see:
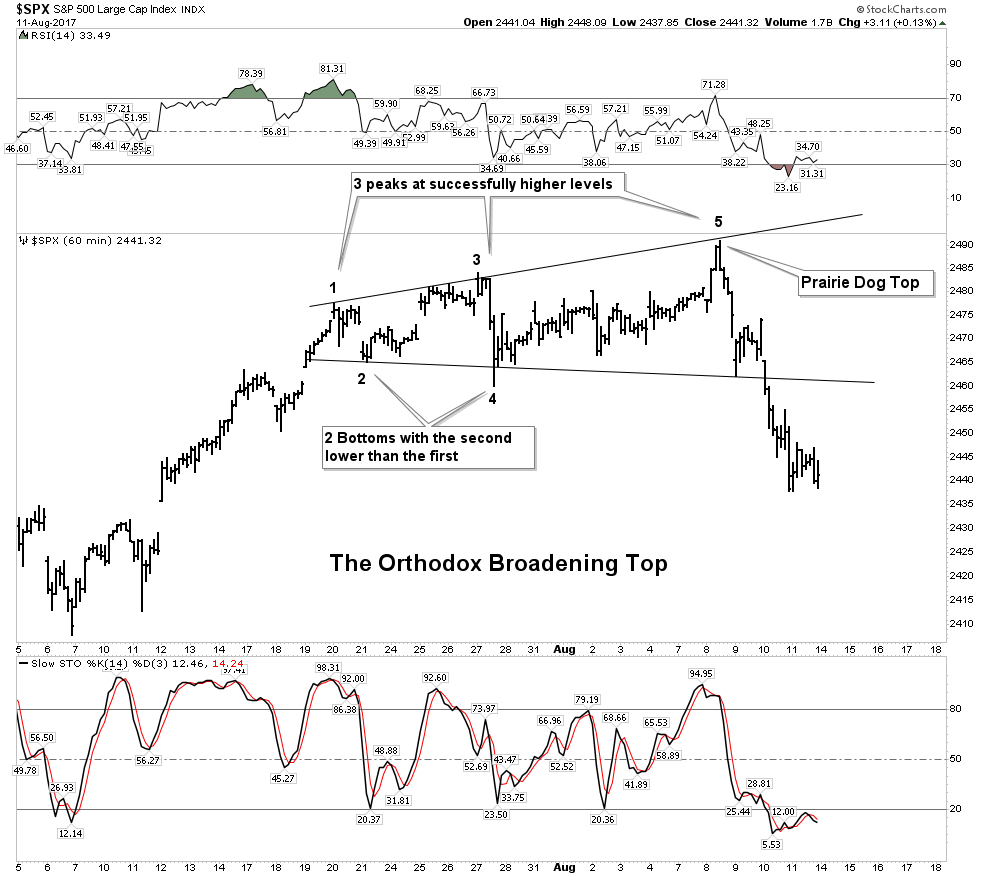
S&P 500 Orthodox Broadening Top
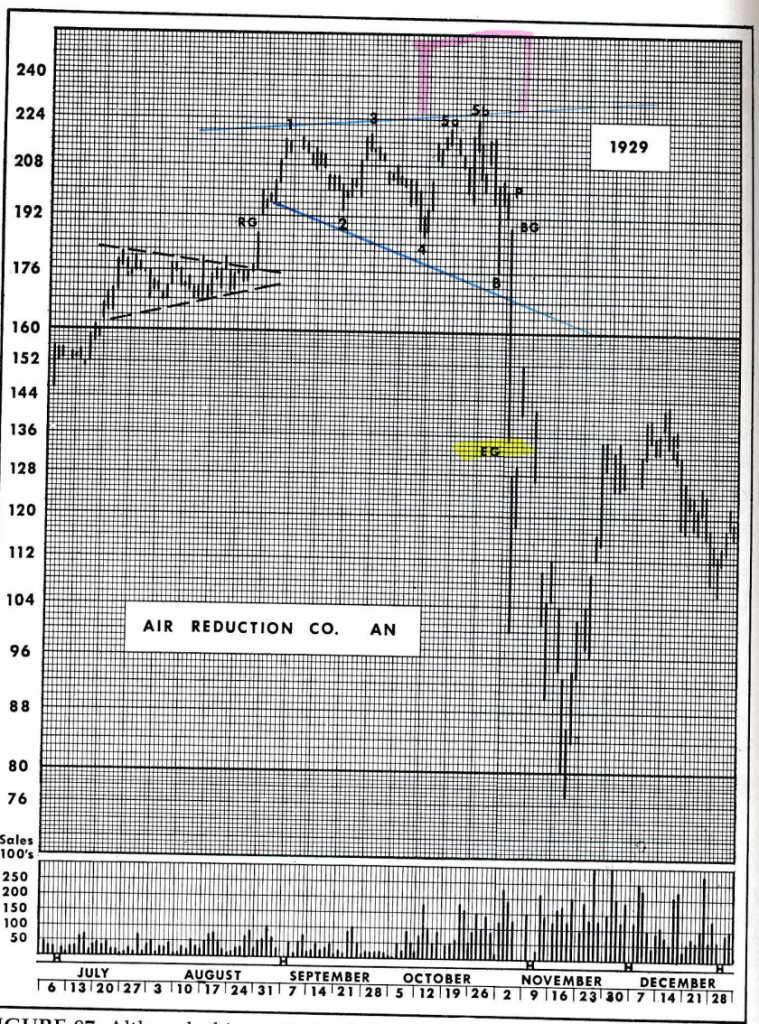
Pull out your copy of the bible of technical analysis: Edwards and Magee. Look under the index for “The Orthodox Broadening Top”. The example they use is Air Reduction Co. from 1929. I will scan and post below:

E&M remind us this type of top comes from low volume markets (check) and it is precisely defined on the chart (check). It’s definition is:
“It has three peaks at successfully higher levels and, between them, two bottoms with the second bottom lower than the first. The assumption has been that it has been completed and an in effect as an important reversal indication just as soon as the reaction from its third peak carries below the level of its second bottom”
Knights, I believe in making charts as simple and uncluttered as possible. Clean charts deliver the most powerful messages. This chart above should make you sit up and take notice. It is classic, right out of the pages of the Edwards and Magee reference book.
My analysis of this chart actually shows weak exhausted action. E&M state that 4 out of 5 examples of this pattern have a re-test of high #3 (point #5). This re-test often exceeds the high by up to 3%. We see this re-test in the above example in Air Reduction Co labeled as 5b. In our present day case we see the S&P spike high in a prairie dog top with no ability to rally for a re-test. This is a case of exhaustion and in my analysis is quite foreboding.
I emphasize that E&M characterize this pattern as “extremely bearish” and it depicts the last stages of a Primary Uptrend. That’s right,- PRIMARY. This was the principle pattern that exhibited itself in numerous individual issues in the 2 months leading into the crash of 1929.
Within this current broadening top formation we can also see two loosely formed H&S tops as well. Bottom line: This is a treacherous reversal pattern.
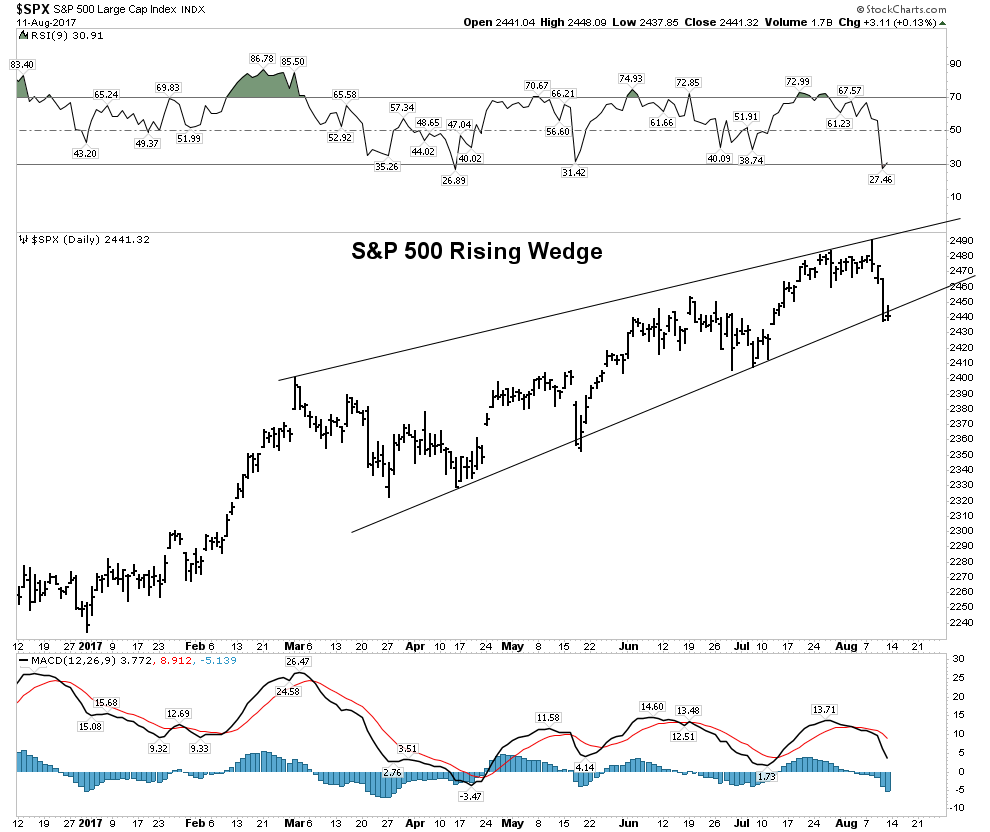
S&P 500 Bearish Rising Wedge
If we step further away and look at a daily chart over the past 8 months we see the S&P 500 forming a presumedly bearish rising wedge. I will cover the investment set-up later on at the end of this section.
Red Flags Everywhere
The FAANG stocks have risen relentlessly all year long, however recently have been broadcasting major trouble ahead. Let’s take a look at some of the red flags:


