

Right now we have a friendly, some say overly friendly, Federal Reserve and a lot of pessimism on the part of investors. Remember people get bearish at bottoms and bullish at tops.
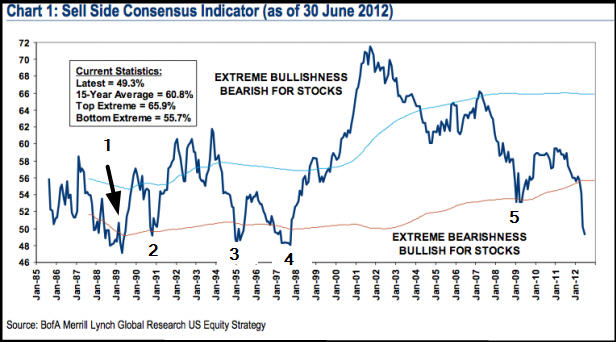
In the nightly commentary of July 3rd, we relate that Merrill Lynch’s proprietary sell side indicator is at its most bearish in 15 years. Previous visits to this level has resulted in substantial rallies. You should re read that update (Ed Note: read the update “Merrill Lynch’s proprietary sell side indicator” at the bottom of this article)
Continuing on the sentiment theme, look at the chart below. The 5 week moving average of the percentage of bulls as measured by the American Association of Individual Investors is below 30%. In the past, that level has tended strongly to be a precursor of substantial multi week rallies, especially during bull markets.
If you look at the extreme left side of the chart, you can see that the indicator did move below 30% and yet, the market went down anyway. Don’t forget that this was toward the end of one of the most corrosive and persistent bear markets of the past 100 years. In those extreme times, the bears tend to be right, but this is an unusual condition. No indicator is flawless.
Another bullish indication is the weekly advance decline line. You can see this in chart form on page 5, but suffice to say that it is at an all time high even though the averages are not. When the internals are outperforming the averages, it is normally good sign.

Merrill Lynch’s proprietary sell side indicator from July 3rd:
SHORT TERM TREND Bullish
INTERMEDIATE TERM TREND Bullish
From:
TODD MARKET FORECAST – Stephen Todd P.O. Box 4131 Crestline, CA 92325-4131


