- This indicator says gold is about to kick off a major buying opportunity
- Simple chart pattern that holds the key to making money in metals
- Plus: The next trade triggers Thursday…
If you’re thinking about buying gold, pay close attention…
A major buying opportunity is about to ignite in everyone’s favorite precious metal.
But you won’t uncover this buy signal by visiting mines, studying gold production, or watching CNBC. In fact, I couldn’t even see it with my naked eye. I needed a sophisticated computer program to alert you to this hidden opportunity.
It was our in-house “quant” Jonas Elmerraji who spotted it thanks to the proprietary indicator he has spent the last five years coding.
And the window is about to kick off this week.
The signal Jonas has pinpointed is highly reliable. It’s made investors money almost 80% of the time over the last 12 years. His system has nailed the price action in gold this year. And that’s not the result of some hypothetical back test, either. In fact, Jonas shared his research on gold with you back in March…
Have a look at an indicator called the Kinetic Composite for GLD, the popular SPDR Gold ETF (NYSE:GLD):
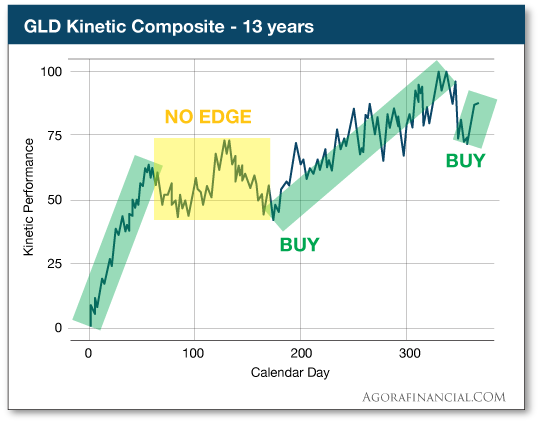
You can think of the Kinetic Composite chart above as a sort of “idealized” price chart for GLD. Jonas’ algorithm crunches decades of price data and mutates it into the chart above. It shows you when a stock is predisposed to rally… up to a year in advance.
You can see how the Kinetic Composite signaled a rally at the start of the year, followed by a volatile sideways period, and then another rally kicking off this summer.
Here’s how GLD’s price has played out in the months since:
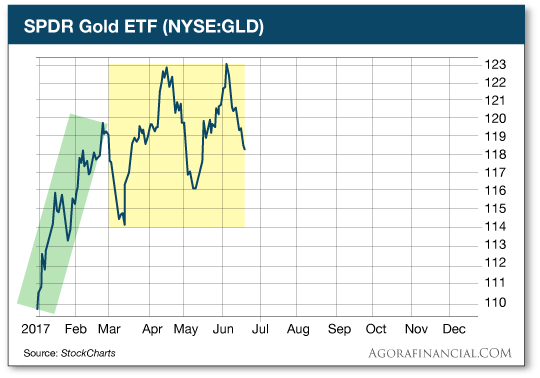
It’s been dead on, from the rally at the beginning of the year, followed by a volatile sideways stretch
Back in March, Jonas recommended staying away from gold during the unpredictable spring months when traders have no statistical edge on gold prices. That’s been a good bet. Gold has gone nowhere — and there have been a lot of opportunities to lose money during the wide swings.
Now, gold looks ready to kick off its next major K-Sign buy signal.
Here’s a quick refresher:
A K-Sign is the 100% proprietary pattern that’s formed by the simplified price line of a stock and its Kinetic Composite. It looks like this:
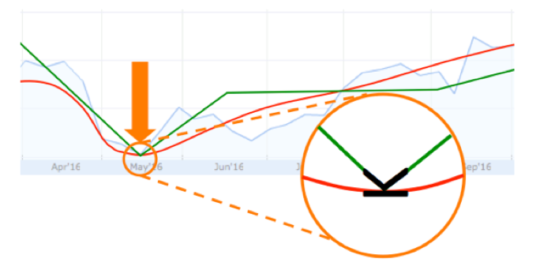
When you see that pattern, the one that looks like a “K” tipped on its back, it means you’re looking at an important buy signal.
Here’s where the next K-Sign triggers in gold:
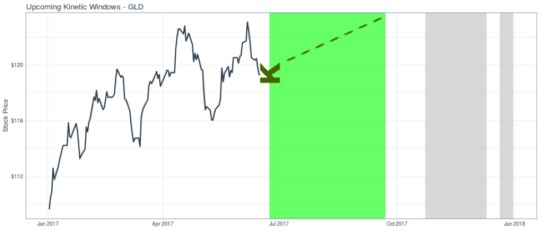
This dead-simple price chart is all you need to look at to make money in gold in 2017.
It shows the next Kinetic Window in gold and the K-Sign date that kicks it off. That date is June 23 – this Friday.
Of course, you might have already known that if you read Jonas’ last gold update in these pages back in March. He told you about the June 23 K-Sign way back then.
Greg Guenthner
Rude Numbers