It’s been awhile since we last looked at the US dollar which has been consolidating its big impulse move up. The reason I haven’t posted it much is because it’s stuck in a sideways trading range going back over a year now.
99.9% of Market participants are either Bullish the Dollar , with all the implications including Lower Gold Prices or Bearish the Dollar, with the opposite implications .
However there are not two but THREE possible outcomes to this present trading range.
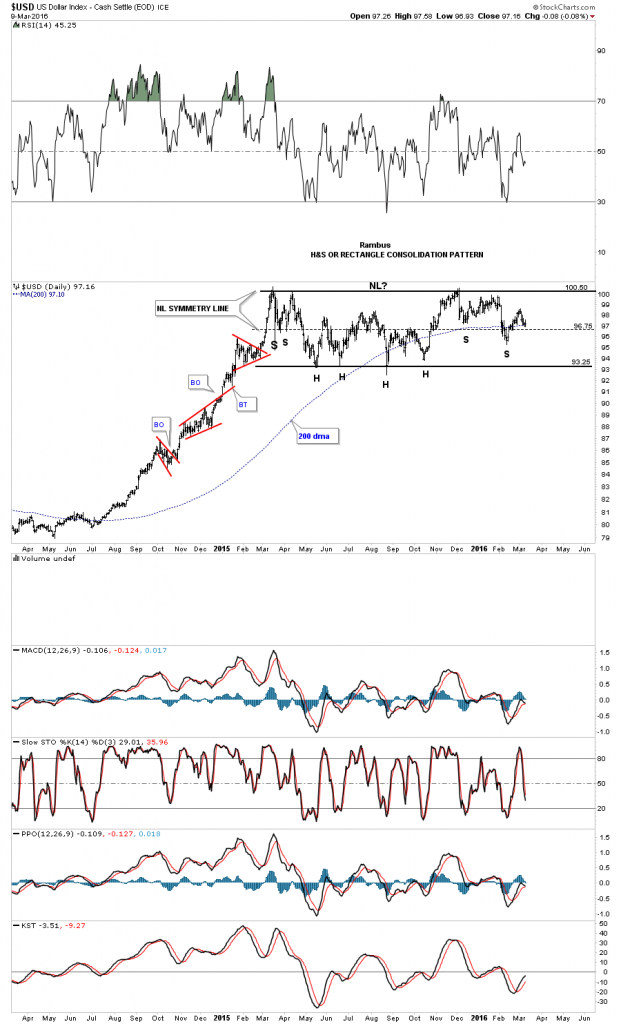
For the Bulls , the breakout is in progress with a present backtest of the bullish flag .
For the bears , if the 200 day ma fails to hold support in this general area for the bottom of a right shoulder, a move back down to the bottom of the trading range would then setup the possible rectangle consolidation pattern around the 93.25 area. The least likely, but is possible, is a huge double top if the price action breaks below the bottom rail.
The third possibility , the one most don’t consider , is a prolonged trading range. At this point I favor the sideways trading range that forms a rectangle consolidation pattern as I explain below.
Note the three smaller red consolidation patterns that formed during its big impulse move up from mid 2014 to the early part of 2015. That’s what a strong impulse move looks like. Normally in strong impulse moves you’ll see at least three smaller consolidation patterns and on rare occasions four which strongly suggests you’re getting close to the end before a much bigger consolidation pattern starts to form. As you can see that is what has taken place so far.