

In deference to Mark Twain, I will review the USD, general stock market, precious metals, the electric metals and various other topics. In the past two weeks Rambus has been so prolific with such high impact charts that I find it a challenge to offer value added material so I offer charts with some different perspectives.
USD-No I Am NOT Dead Yet!
Currencies tend to be a very emotional subject. I try to be objective when analyzing them, sticking to the language of the market and it’s message. It is always important to guard against the gold bug narrative, it can even influence our views of currencies. Demanding posts insisting the USD is toast and immediately headed towards history’s ash heap seem closely related to this gold bug narrative. The USD has spent the first 8 months of 2017 in a well defined downtrend, however it does not appear to be in a death spiral. Actually the shouting and insistence that it must continue down has been a fairly predictable sign that its move downward was reaching its limit. The dollar may have now completed a base and is set to continue its move higher. This is not dogma as it could reverse downward, but for now it’s making all the right moves if the trend is higher.
Please review Rambus’ October 25 post on the USD as there is no other finer analysis anywhere:
I have often made the point that we are in a post bubble contraction. It began with the financial crisis in 2007, however the central banks of the world and their interventions have truncated the natural corrective process and re-inflated the bubble due to financial engineering. Ultimately, if robust growth is to ever return to the world’s economies the PBC must be allowed to do its work in de-levering balance sheets. Historically in the previous 5 episodes over the past 340 years, PBCs have taken 15-20 years to accomplish this. So this is a slow process and the 8 month downtrend of the USD in 2017 could just be a little wiggle that turns out to be just a correction in an ongoing up-trend. Time will tell of course. In a PBC, the senior currency becomes chronically strong and acts as a magnet attracting capital flows from around the world. Over the past year this economic principle has been very hard to accept, however it may be getting ready to reassert itself. I personally don’t trade currencies, however I watch them since they drive asset classes and knowing their trend gives us a clue of where these assets will themselves trend.
It appears we are at a crucial point in currency markets as the USD is beginning to reassert itself. Lets look at the various currency charts vs the USD:
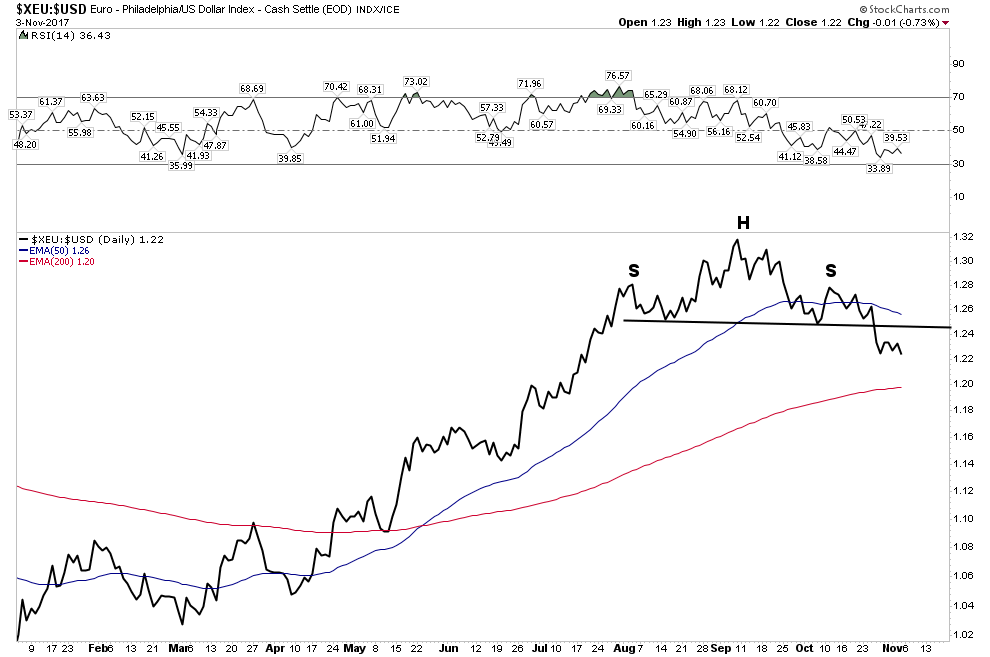
Euro- H&S neckline now broken:
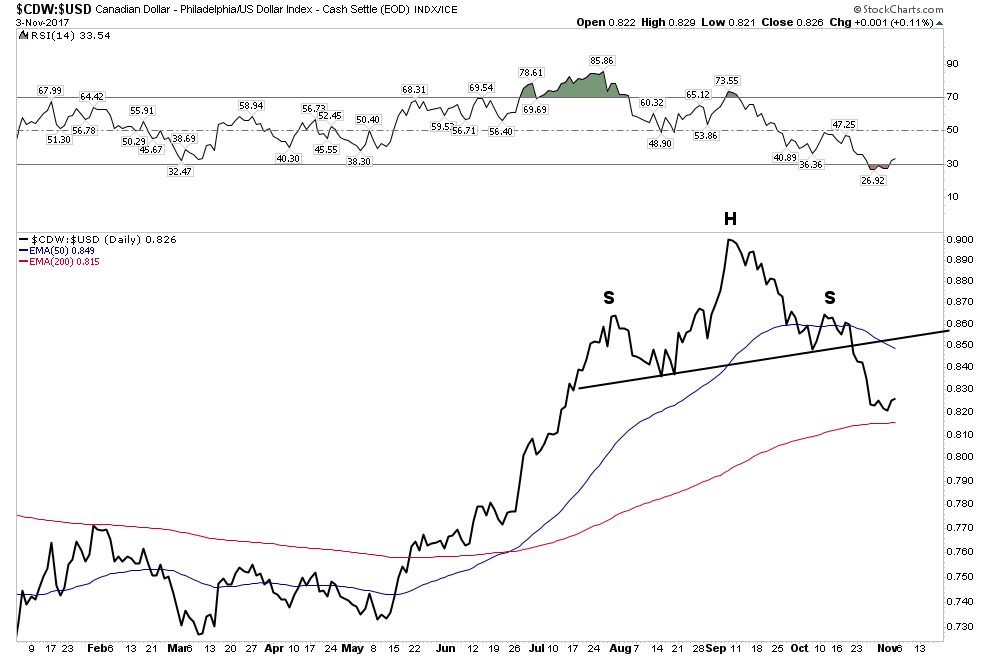
Canadian Dollar– The ultimate resource currency
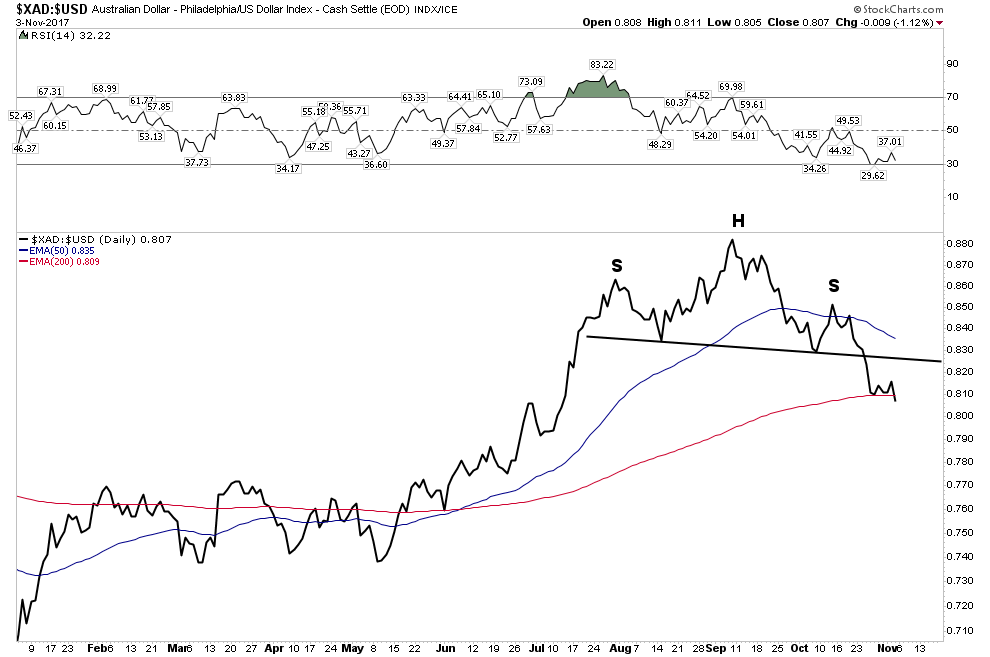
Aussie Dollar– H&S break with price now violating the 200 EMA
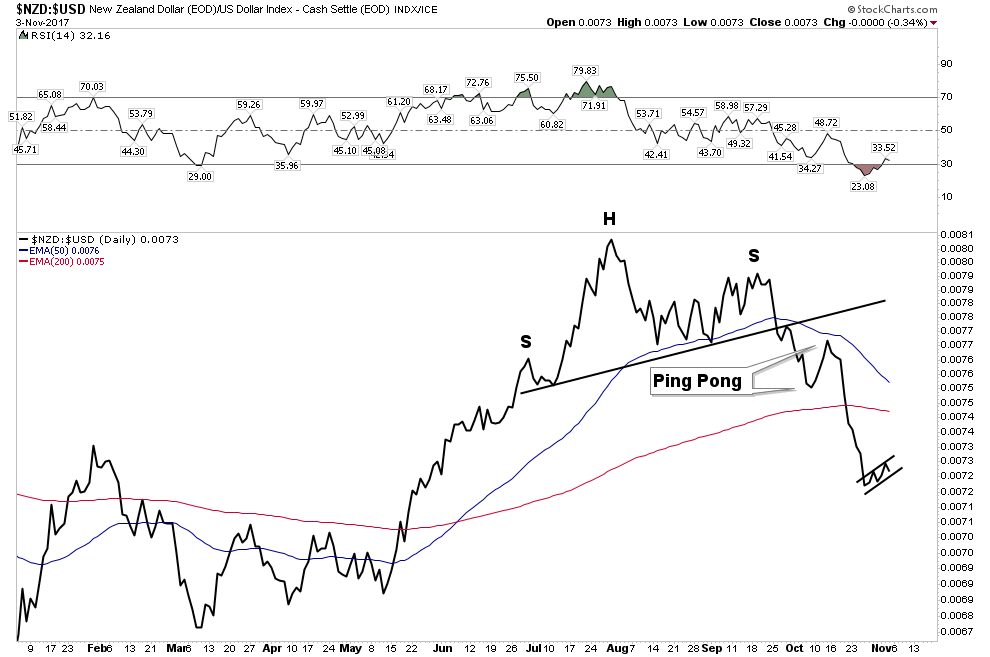
NZD– The first to show its hand
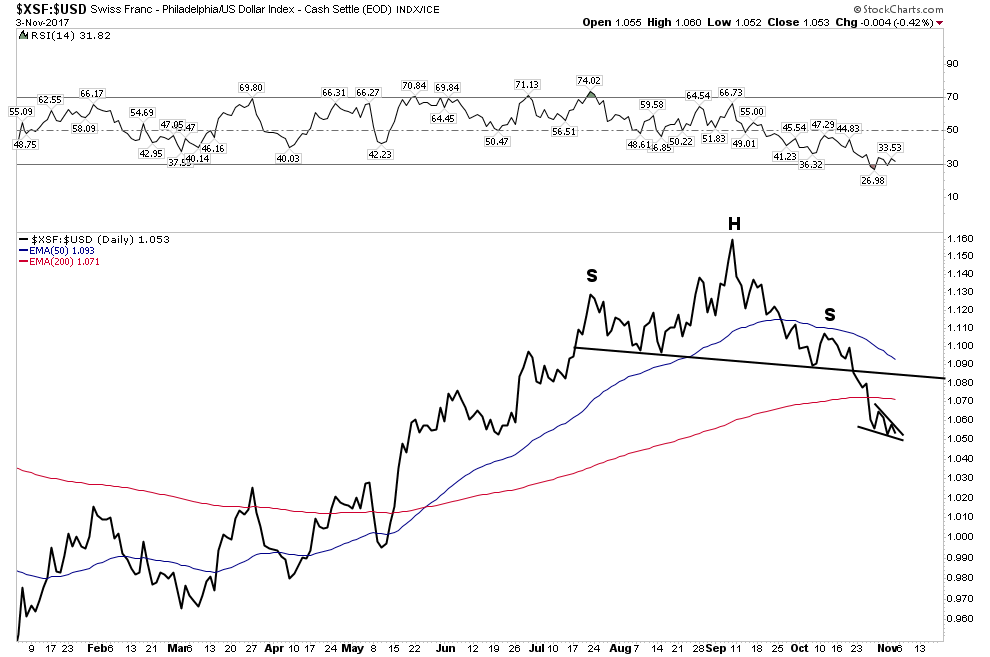
The Swissie: Et tu? Even the ultimate haven currency… 200 EMA violation.
South Africa Rand:
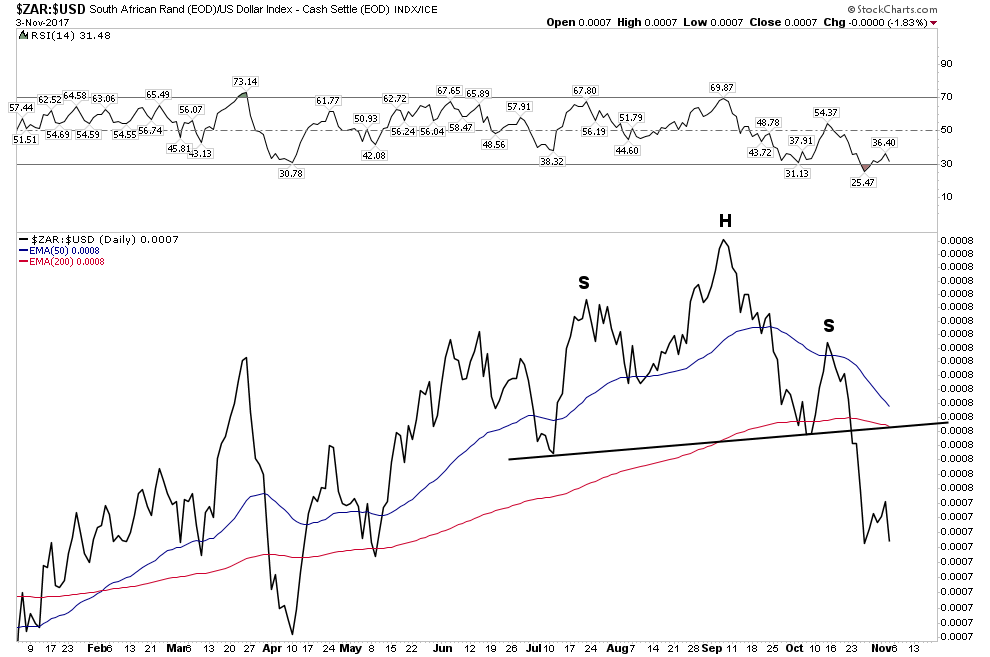
So one can see all of these currencies are now in a broad based breakdown vs the USD. The USD took some time to gain traction and it’s NOT out of the woods yet, but these charts show that it would take some work to reverse this initial trend reversal.
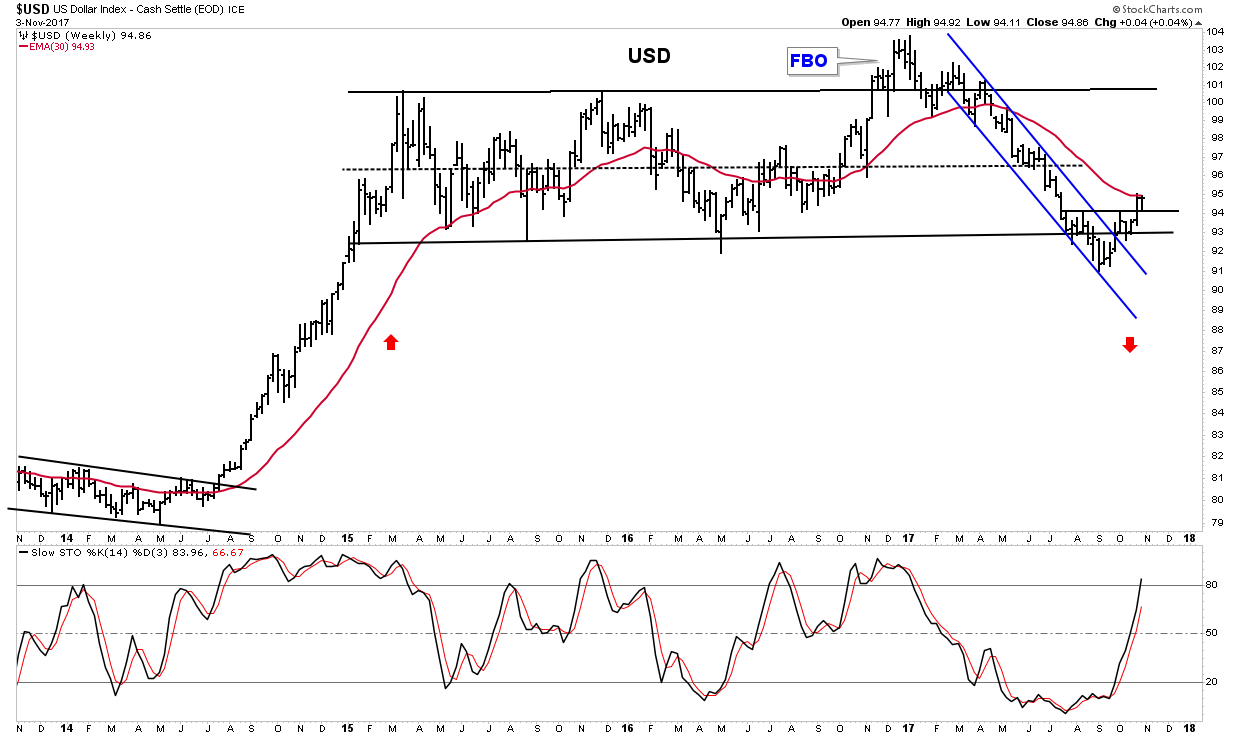
In the chart below we see how the USD has broken above its lower horizontal channel line and is now attempting to overcome the resistance of the 30 W EMA. Stochastics are indicating that it has the momentum to continue its move higher.
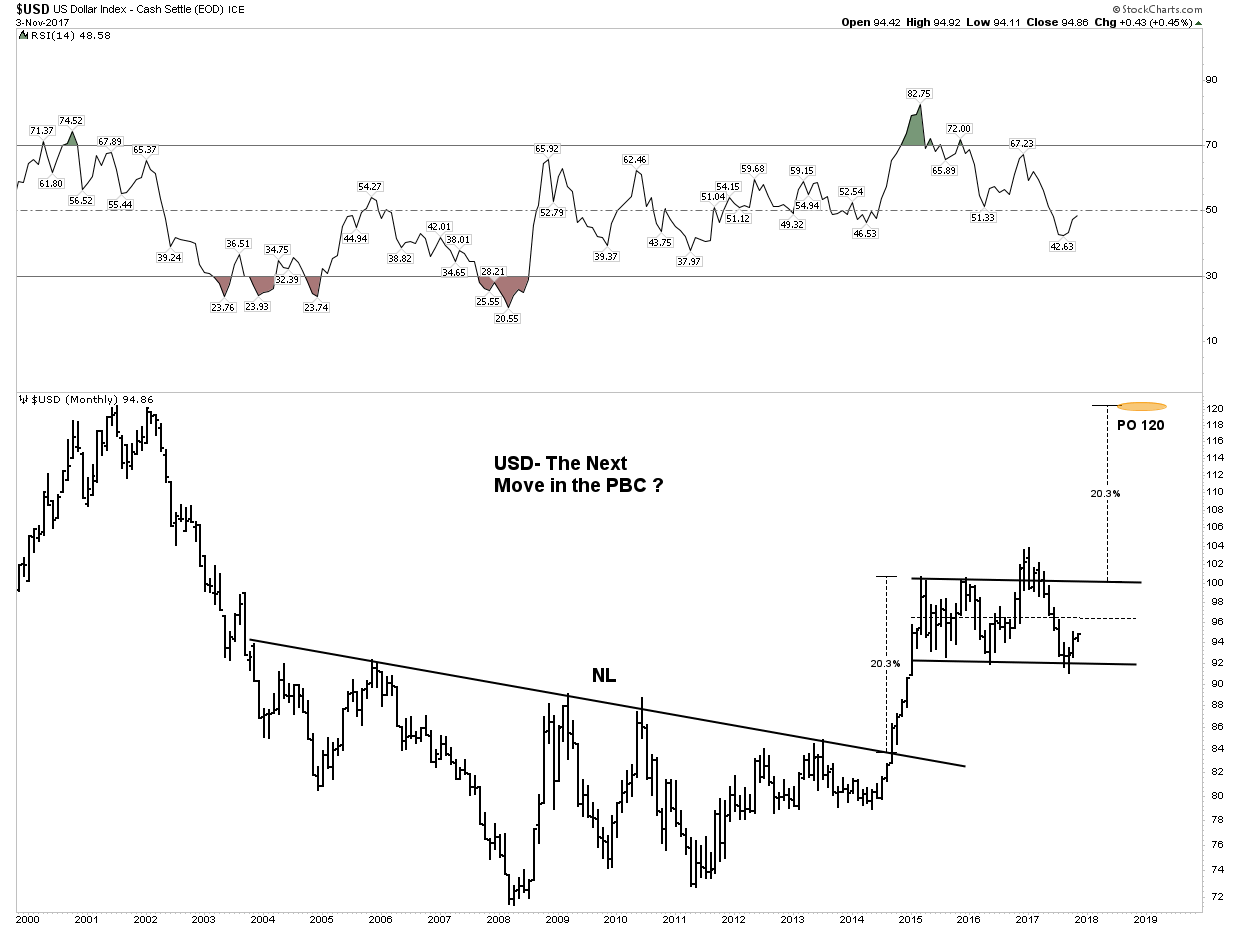
Below is the chart that has been subject to ridicule and derision, however it depicts what could occur when the PBC reasserts itself. It is certainly not a guarantee, however it shows what may lie in store.
This next chart shows the relationship between the USD and the three metals: gold, silver and copper. It is hinting that if the USD continues to rally it could make it difficult for these three metals to advance much further:
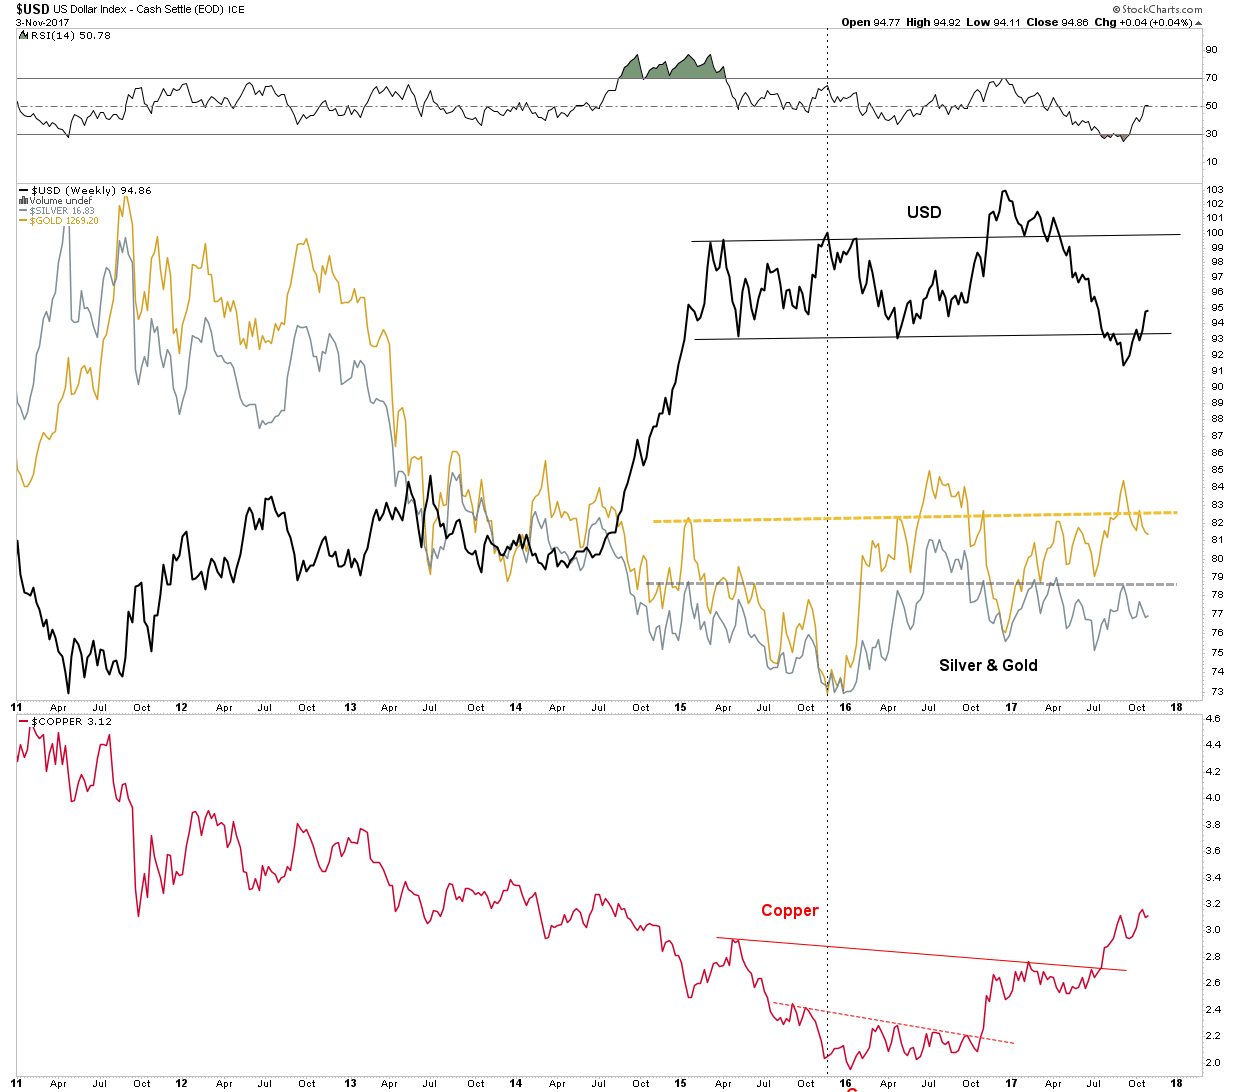
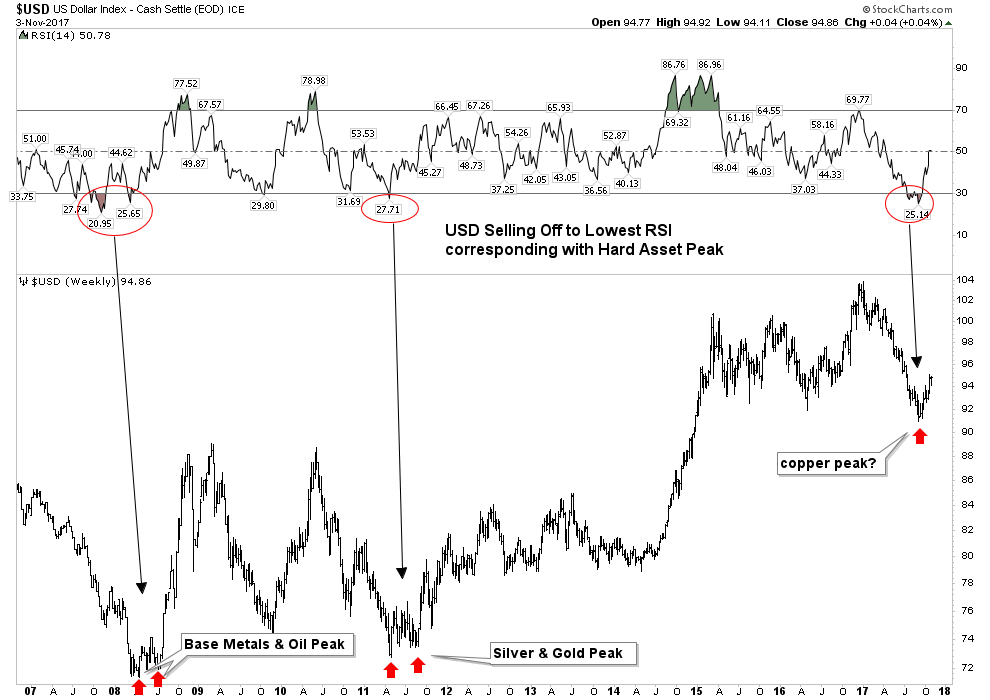
Finally, this USD chart poses the question: are the industrial metals getting ready to end their run for now? It seems that in the past when the USD reversed from being oversold on the weekly that was the message:
The Stock Market- From Here to Infinity?
Rambus has shown that the move upward in the stock market continues to be unimpeded. I would concur with the caveat that early next year it may peak and end the 9 year bull market, so far the second longest in history. Momentum is still powering higher, however internal deterioration has begun to be evident. Here is one possible scenario for the ultimate top:
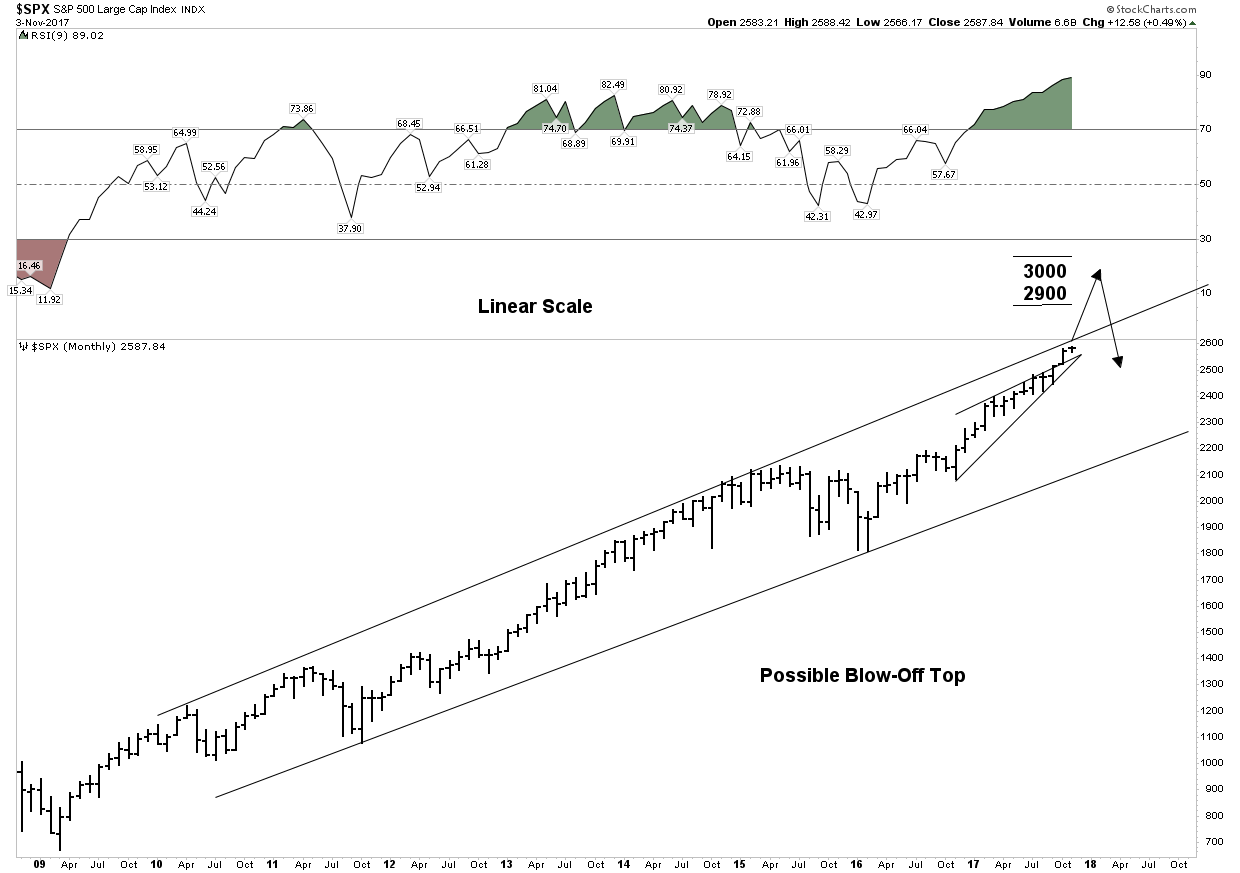
Above is a linear scale view of the 9 year bull market. It depicts a blow off top penetrating the upper trend channel with a target of 2900-3000. We see 3 phases to this bull market and the blow off would end the final phase III “mania”. Note the extreme reading in the RSI lending credence to this outcome.
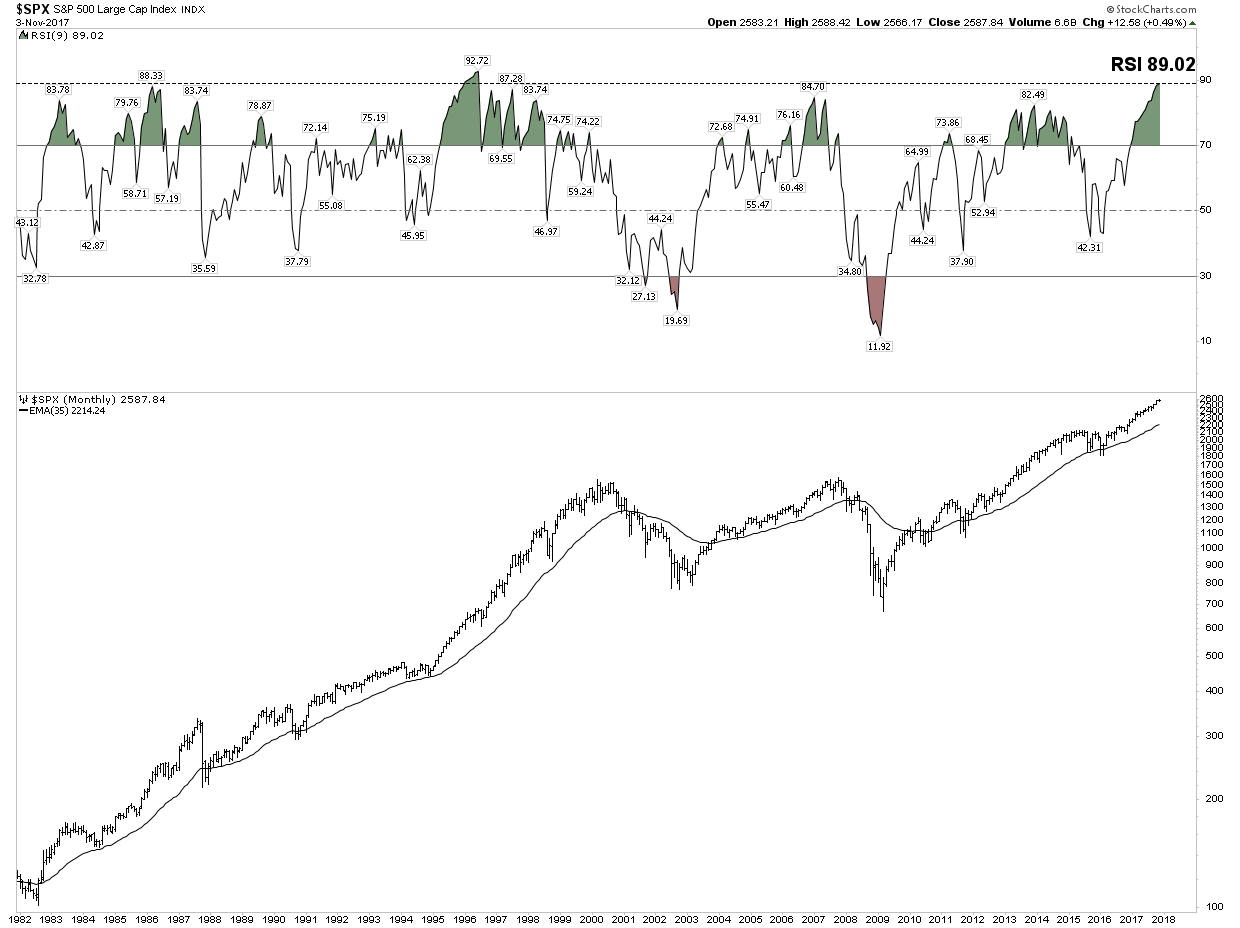
Below is a chart which highlights just how overbought and extended this market has become. It is a monthly view of the entire 36 year secular bull market. Note the RSI is now the second highest in the entire bull market. It is saying this relentless rise has reached a point where the RSI will limit its move.
I would like to show just how narrow the advance has become. We all know how the FANG stocks have led the market. The XLK includes a heavy weighting made up of the FANGS and FANG-like stocks. The rise been relentless:
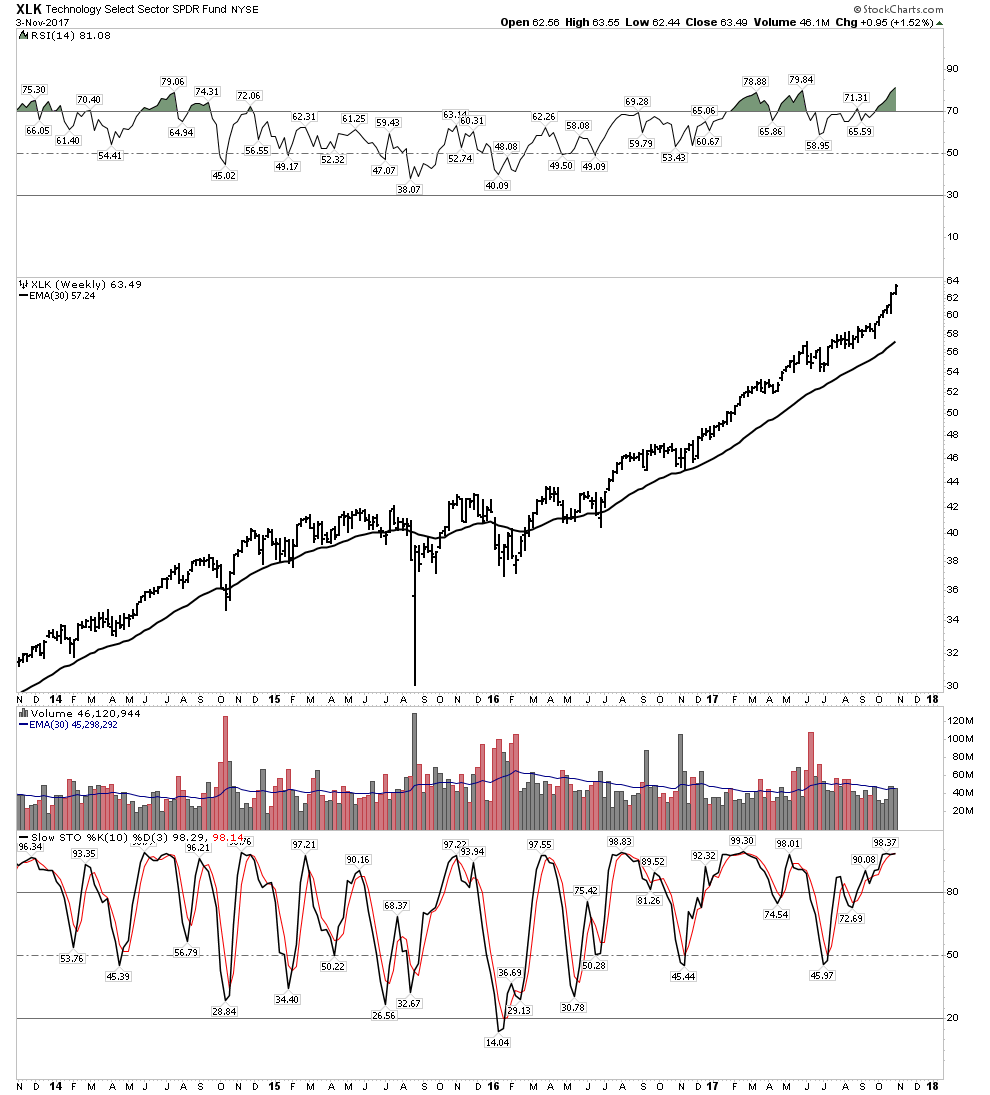
Note how extended stochastics and RSI have become. Also note how volume is trailing off despite this recent blow off move.
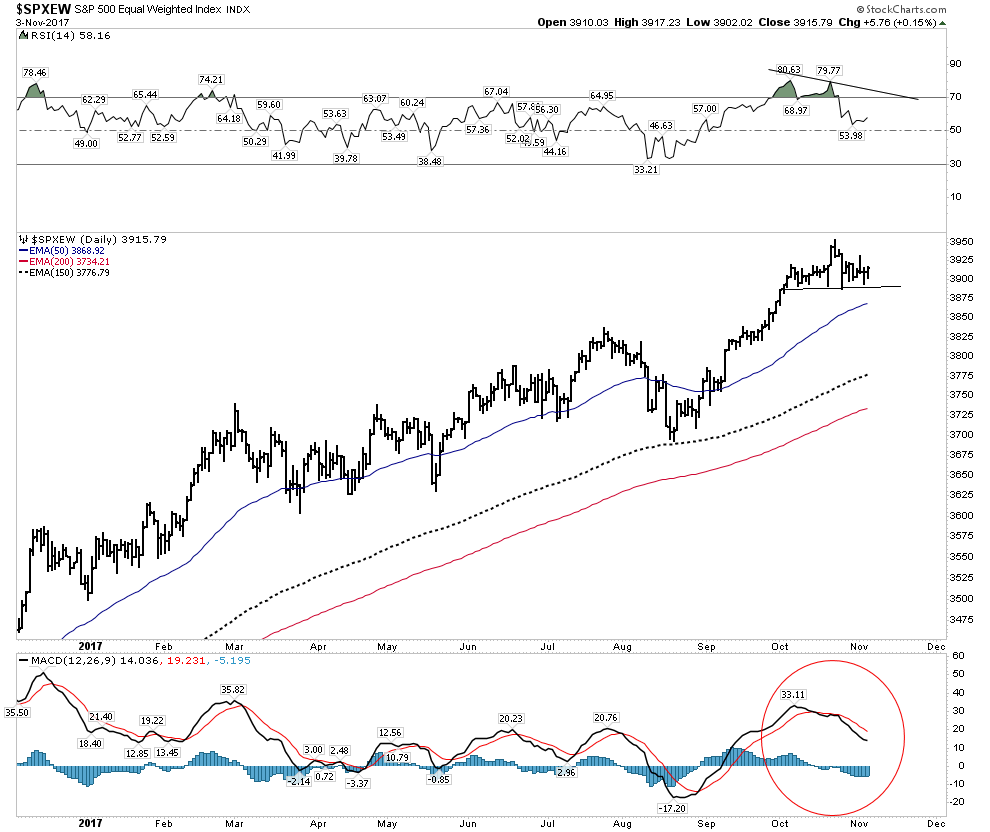
SPX-Equal Weighted Index
Below is the SPX represented as an equal weighted index. It values all 500 stocks equally vs the normal cap weighted measure. Here we see the trend solidly upward, however note that RSI is waning and it may be putting in a H&S top. MACD momentum is also indicating weakness.
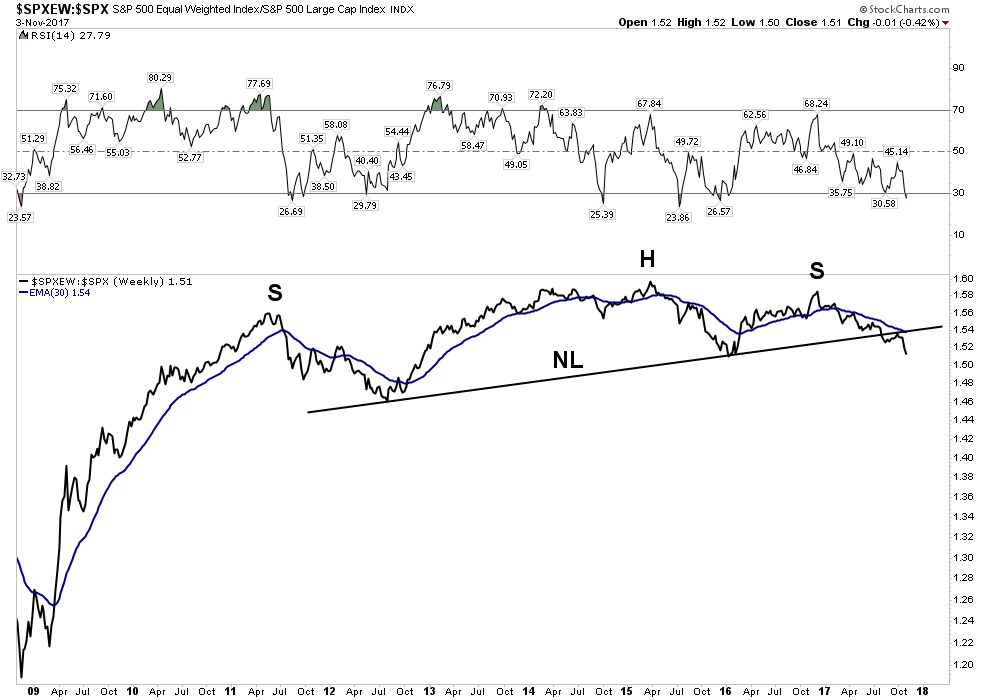
Now let’s go back and view the entire 9 year bull market and subtract out the cap weighted influence of the index as opposed to just neutralizing it. You will see it reveals the core of the market has not really gone anywhere for 7 years and it has recently broken its NL, followed up with a BT and is now resuming its downtrend.
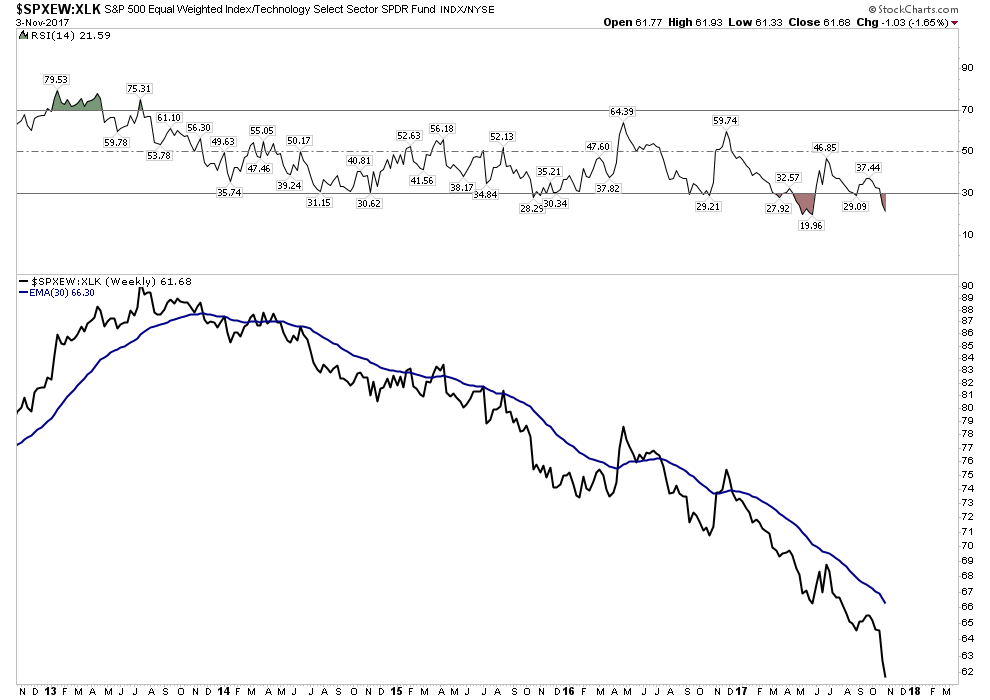
Finally, let’s remove the effect of the super momentum driven XLK for the past 5 years and what is revealed is something really shocking. That of course is a total implosion of the core of the market relative to the momentum driven XLK. The message here for us to understand is that this market is being driven by money flows into an increasingly narrow sector of the market. This is a classic final phase characteristic of a blow off market. It is not announcing an end tomorrow, but it tells one what season we are in.
Let’s look at a few charts that you should be aware of. Again, the message is not that the end is here, but the internals are deteriorating:
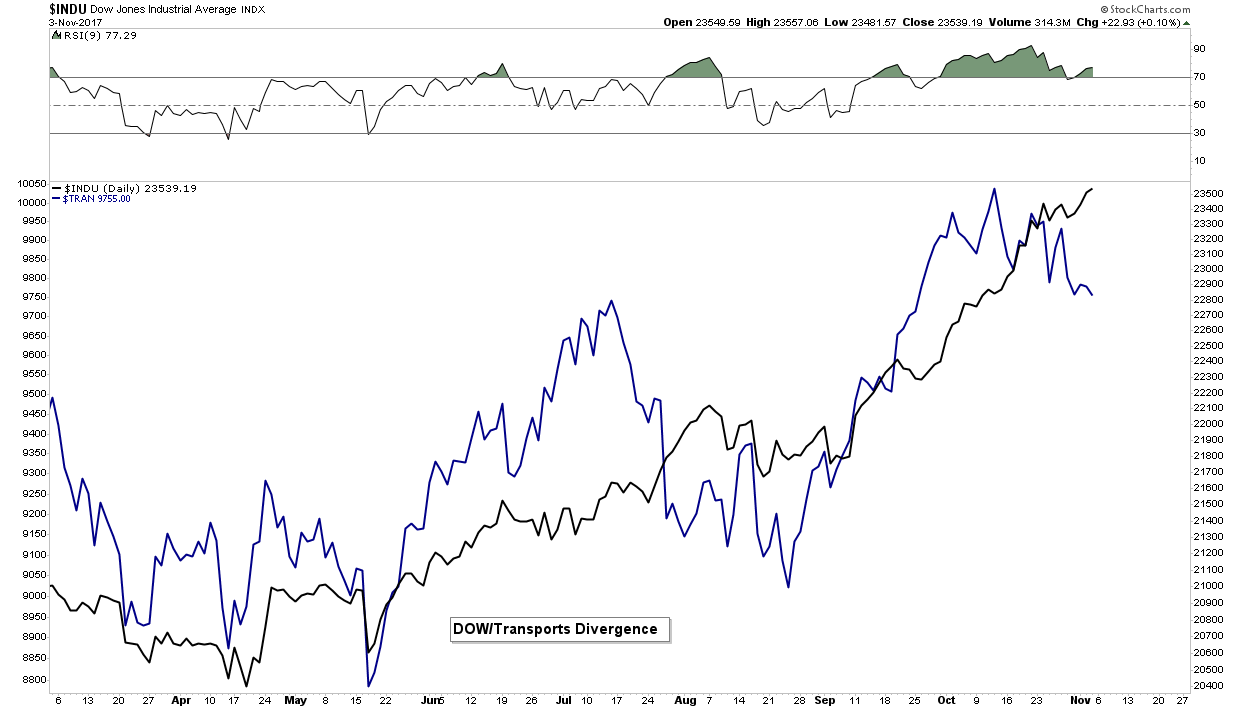
Dow Theory- Non Conformation
It’s only been in effect for three weeks, however this divergence needs to be corrected by the transports resuming its uptrend. Without a reversal upside, it signals trouble ahead:
…..continue looking at 35 more fascinating 35 charts Rambus has put together in this report HERE after which comes his:
Conclusion
The general markets continue to power higher with momentum firmly intact. If you are playing this sector you are making money, but be careful as numerous signs point to a top within 2-4 months. Meanwhile the PM sector is getting beaten up, but therein may lie the opportunity of a lifetime, especially now that we know the new FED chair is just another Brainless Keynesian who thinks there will never be any repercussions to endless money printing. Perhaps it’s time to take our eye off of the shiny object and buy what is real value, the precious and the electric metals.


