
For Wednesday March 30, 2016, 3:00 Pacific.
DOW + 84 on 750 net advances
NASDAQ COMP + 23 on 650 net advances
SHORT TERM TREND Bullish
INTERMEDIATE TERM TREND Bearish
STOCKS: The day after the Federal Reserve Chair, Janet Yellen adopted a continued dovish stance on interest rates, the market celebrated still again.
The economy is doubtful and earnings are slow, but investors are still mesmerized by the Federal Reserve. We have a name for this type of action. It’s called climbing a wall of worry.
GOLD: Gold dropped $1 in spite of a lower dollar. Gold looks suspiciously like it’s peaking.
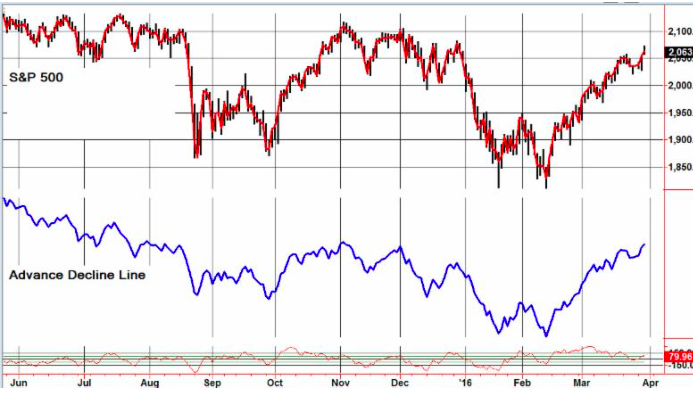
CHART: The S&P 500 is still making a pattern of ascending highs and lows, but it is fast approaching the resistance levels that turned the market down in November and December.

BOTTOM LINE: (Trading)
Our intermediate term system is on a sell.
System 7 We are long the SSO at 62.63. Stay with it on Thursday.
System 8 We are in cash. Stay there.
GOLD We are in cash. Stay there.
News and fundamentals: The ADP employment report showed that 200,000 jobs were added, matching expectations.
Interesting Stuff: I have a theory about economists. They’re always wrong about everything, especially globalization.
TORONTO EXCHANGE: Toronto gained 78.
BONDS: Bonds fell back a bit.
THE REST: The dollar moved lower. Silver was up. Crude oil was down slightly.
Bonds –Bullish as of March 23.
U.S. dollar – Bearish as of March 7.
Euro — Bullish as of March 7
Gold —-Bearish as of March 14.
Silver—- Bearish as of February 22.
Crude oil —- Bullish as of March 17.
Toronto Stock Exchange—- Bullish from January 22.
S&P\ TSX Venture Fund — Bullish from January 29.
We are on a long term buy signal for the markets of the U.S., Canada, Britain, Germany and France.
| Tue. | Wed. | Thu. | Mon. | Tue. | Wed. | Evaluation | |
| Monetary conditions | 0 | 0 | 0 | 0 | 0 | 0 | 0 |
| 5 day RSI S&P 500 | 81 | 57 | 53 | 58 | 76 | 81 | – |
| 5 day RSI NASDAQ | 83 | 51 | 56 | 49 | 75 | 79 | – |
|
McCl-
lAN OSC.
|
+90 | -3 | -12 | -2 | +70 | +80 |
0
|
| Composite Gauge | 11 | 17 | 10 | 11 | 4 | 8 | 0 |
| Comp. Gauge, 5 day m.a. | 7.6 | 9.8 | 10.6 | 11.4 | 10.6 | 10.0 | 0 |
| CBOE Put Call Ratio | 1.08 | 1.03 | 1.04 | .82 | .99 | 1.12 |
+
|
| VIX | 14.17 | 14.94 | 14.74 | 15.24 | 13.82 | 13.56 | |
| VIX % change | +3 | +5 | -1 | +3 | -9 | -2 | 0 |
| VIX % change 5 day m.a. | -3.4 | -0.2 | +0.4 | +1.6 | +0.2 | -0.8 | 0 |
| Adv – Dec 3 day m.a. | +136 | -582 | -553 | -323 | +690 | +927 | – |
| Supply Demand 5 day m.a. | .73 | .61 | .65 | .60 | .63 | .60 | 0 |
| Trading Index (TRIN) | 1.25 | 2.09 | .78 | 1.22 | 1.38 | .84 |
0
|
|
S&P 500
|
2050 | 2037 | 2036 | 2037 | 2055 | 2064 | Plurality – 2 |
INDICATOR PARAMETERS
Monetary conditions (+2 means the Fed is actively dropping rates; +1 means a bias toward easing. 0 means neutral, -1 means a bi


