
DOW + 301 on 1000 net advances
NASDAQ COMP + 79 on 1350 net advances
SHORT TERM TREND Bullish
INTERMEDIATE TERM Bullish
STOCKS: Sometimes we’re not sure why the stock market does what it does, but this time there is no doubt. President Trump’s tone caught many doubters off guard. He was presidential and positive.
Of course, underneath, things haven’t changed. Investors continue to be encouraged by promises of lower taxes, less regulation and infrastructure spending.
After struggling for a while with Dow 20,000, the blue chip index spent just 24 sessions going the next 1,000 points, tied for the fastest ever/
GOLD: Gold dropped $4. It was down much more intraday. Less political tension dissuaded buyers.
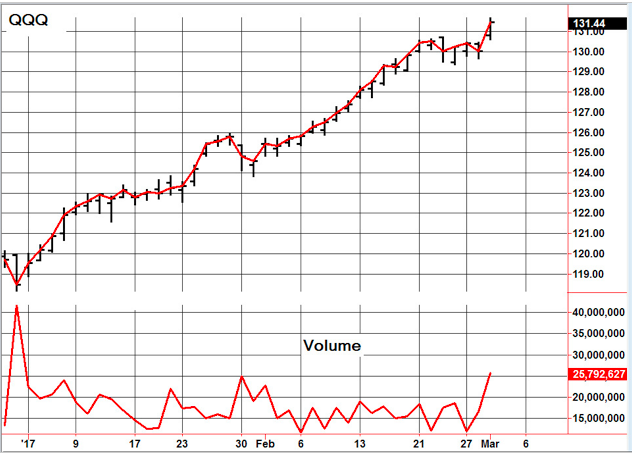
CHART The volume rose sharply on the QQQ which is the ETF for the NASDAQ 100. This frequently marks some sort of a turn, Usually it’s seen at bottoms, but occasionally at tops. We’ll need to keep an eye n this short term indicator. We’re indebted to our friend Tom McClellan of the McClellan Financial Publications for pointing this out.

BOTTOM LINE: (Trading)
Our intermediate term system is on a buy.
System 7 We are in cash. Stay there for now.
System 8 We are long the SSO at 85.05. If there are more declining issues than advancing ones at 3:35 EST on Thursday, sell at the close.
NEWS AND FUNDAMENTALS: Personal income rose 0.4%, better than the anticipated 0.3%. The PMI mfg. index was 54.2, less than the expected 55.0. The ISM mfg. index came in at 57.7, better than the expected 56.4. Construction spending dropped 0.1%, worse than the expected rise of 0.05%. Oil inventories rose 1.5 million barrels. Last month, they rose 600,000.
INTERESTING STUFF: Paul Krugman, Nobel laureate economist with the New York Times said back in November that if Donald Trump won, the stock market would drop and never come back.
TORONTO EXCHANGE: Toronto rose a cool 200.
BONDS: Bonds dropped sharply.
THE REST: The dollar surged. Silver flat to down. Crude oil lost ground.
Bonds –Bullish as of Feb. 6.
U.S. dollar -Bullish as of Feb. 9.
Euro — Bullish as of December 2.
Gold —-Bullish as of Feb. 16.
Silver—- Bullish as of Jan. 31.
Crude oil —- Bearish as of Nov. 29.
Toronto Stock Exchange—- Bullish from January 22, 2016
We are on a long term buy signal for the markets of the U.S., Canada, Britain, Germany and France.
|
|
Wed. |
Thu. |
Fri. |
Mon. |
Tue. |
Wed. |
Evaluation |
|
Monetary conditions |
-1 |
-1 |
-1 |
-1 |
-1 |
-1 |
0 |
|
5 day RSI S&P 500 |
86 |
87 |
89 |
90 |
68 |
88 |
– |
|
5 day RSI NASDAQ |
89 |
67 |
70 |
76 |
50 |
74 |
– |
|
McCl- lAN OSC. |
+12 |
+11 |
-2 |
+13 |
-39 |
+7 |
0
|
|
Composite Gauge |
8 |
10 |
8 |
9 |
14 |
7 |
0 |
|
Comp. Gauge, 5 day m.a. |
8.2 |
8.4 |
8.0 |
8.2 |
9.8 |
9.6 |
0 |
|
CBOE Put Call Ratio |
.89 |
.83 |
.83 |
.83 |
1.18 |
.86 |
0 |
|
VIX |
11.74 |
11.71 |
11.47 |
12.09 |
12.92 |
12.54 |
|
|
VIX % change |
+1 |
0 |
-2 |
+5 |
+7 |
-3 |
0 |
|
VIX % change 5 day m.a. |
+1.8 |
-0.4 |
-0.4 |
+1.0 |
+2.2 |
+1.4 |
0 |
|
Adv – Dec 3 day m.a. |
+191 |
+354 |
-63 |
+240 |
-97 |
+243 |
0 |
|
Supply Demand 5 day m.a. |
.86 |
.78 |
.84 |
.80 |
.73 |
.75 |
0 |
|
Trading Index (TRIN) |
1.38 |
1.52 |
1.64 |
.82 |
1.38 |
.61 |
0
|
|
S&P 500
|
2363 |
2364 |
2367 |
2370 |
2364 |
2396 |
Plurality -2 |
INDICATOR PARAMETERS
Monetary conditions (+2 means the Fed is actively dropping rates; +1 means a bias toward easing. 0 means neutral, -1 means a bias toward tightening, -2 means actively raising rates). RSI (30 or below is oversold, 80 or above is overbought). McClellan Oscillator ( minus 100 is oversold. Plus 100 is overbought). Composite Gauge (5 or below is negative, 13 or above is positive). Composite Gauge five day m.a. (8.0 or below is overbought. 13.0 or above is oversold). CBOE Put Call Ratio ( .80 or below is a negative. 1.00 or above is a positive). Volatility Index, VIX (low teens bearish, high twenties bullish), VIX % single day change. + 5 or greater bullish. -5 or less, bearish. VIX % change 5 day m.a. +3.0 or above bullish, -3.0 or below, bearish. Advances minus declines three day m.a.( +500 is bearish. – 500 is bullish). Supply Demand 5 day m.a. (.45 or below is a positive. .80 or above is a negative). Trading Index (TRIN) 1.40 or above bullish. No level for bearish.
No guarantees are made. Traders can and do lose money. The publisher may take positions in recommended securities.


