
DOW + 76 on 850 net advances
NASDAQ COMP + 33 on 1200 net advances
SHORT TERM TREND Bullish
INTERMEDIATE TERM TREND Bullish
STOCKS: On Tuesday, the uptrend seemed to be based on a couple of things. No bad news from China or Greece and some decent bank earnings.
And, of course, the action of the past couple of days seemed to provided momentum.
GOLD: Gold was down another $1. It just keeps dropping albeit modestly.
NEXT DAY: Wednesday – No prediction.
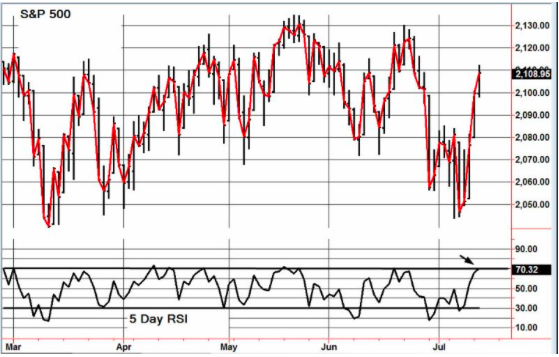
CHART: Five day RSI is just peeking into the overbought range (arrow). Let’s keep a close eye here. My estimate is that there is still unfinished business on the upside.

BOTTOM LINE: (Trading)
Our intermediate term system is on a buy. We are long the SPY from 206.42. Hold for now.
System 7 We are long the SSO from 65.70. Hold for now.
System 8 We are in cash. Stay there.
GOLD We are in cash. Stay there.
News and fundamentals: Retail sales dropped 0.3%. The expectation was for a rise of 0.3%. On Wednesday we get PPI – FD, the Empire State mfg. survey, industrial production and the Fed Beige Book.
Interesting Stuff A year ago, Janet Yellen said that bio techs were somewhat over extended. At that time the appropriate ETF, the XBI, was at 139. Today it closed at 265. Economists are wrong a lot. It’s nice to be able to occasionally quantify their wrongness.
TORONTO EXCHAN GE: Toronto was up 66.
S&P/TSX VENTURE COMP: The TSX was higher by 2.
BONDS: Bonds were up modestly.
THE REST: The dollar fell back. Silver was down mildly. Crude oil curled up.
We’re on a buy for bonds as of June 11.
We’re on a sell for the dollar and a buy for the euro as of July 10.
We’re on a sell for gold as of July 2.
We’re on a sell for silver as of June 23.
We’re moving to a buy for crude oil as of July 14.
We’re on a sell for the Toronto Stock Exchange as of May 6.
We’re on a sell for the S&P\TSX Venture Fund as of October 30.
We are on a long term buy signal for the markets of the U.S., Canada, Britain, Germany and France.
|
Mon. |
Tue. |
Wed. |
Thu. |
Fri. |
Mon. |
Tue. |
Evaluation |
|
|
Monetary conditions |
+ |
+ |
+ |
+ |
+ |
+ |
+ |
+ |
|
5 day RSI S&P 500 |
34 |
49 |
27 |
26 |
54 |
66 |
70 |
– |
|
5 day RSI NASDAQ |
33 |
36 |
19 |
25 |
58 |
68 |
70 |
– |
|
McCl- lAN OSC. |
-68 |
-34 |
-123 |
-67 |
+41 |
+110 |
+140 |
– |
|
Composite Gauge |
13 |
8 |
17 |
13 |
7 |
3 |
7 |
0 |
|
Comp. Gauge, 5 day m.a. |
12.2 |
10.4 |
11.6 |
12.4 |
11.6 |
9.6 |
9.4 |
0 |
|
CBOE Put Call Ratio |
1.07 |
1.25 |
1.44 |
1.17 |
1.00 |
.57 |
.97 |
0 |
|
VIX |
17.01 |
17.09 |
19.64 |
19.97 |
16.83 |
13.90 |
13.37 |
0 |
|
VIX % change |
+1 |
-5 |
+4 |
+2 |
-16 |
-17 |
-4 |
0 |
|
VIX % change 5 day m.a. |
+5.0 |
-2.8 |
-1.4 |
+1.2 |
-2.8 |
– 6.4 |
-2.2 |
0 |
|
Adv – Dec 3 day m.a. |
-35 |
-104 |
-778 |
-311 |
+113 |
+1233 |
+1322 |
– |
|
Supply Demand 5 day m.a. |
.40 |
.58 |
.52 |
.40 |
.48 |
.57 |
.54 |
0 |
|
Trading Index (TRIN) |
1.53 |
.81 |
3.21 |
.81 |
.88 |
.60 |
.73 |
0 |
|
S&P 500 |
2069 |
2081 |
2047 |
2051 |
2077 |
2100 |
2109 |
Plurality -3 |
INDICATOR PARAMETERS
Monetary conditions (+2 means the Fed is actively dropping rates; +1 means a bias toward easing. 0 means neutral, -1 means a bias toward tightening, -2 means actively raising rates). RSI (30 or below is oversold, 80 or above is overbought). McClellan Oscillator ( minus 100 is oversold. Plus 100 is overbought). Composite Gauge (5 or below is negative, 13 or above is positive). Composite Gauge five day m.a. (8.0 or below is overbought. 13.0 or above is oversold). CBOE Put Call Ratio ( .80 or below is a negative. 1.00 or above is a positive). Volatility Index, VIX (low teens bearish, high twenties bullish), VIX % single day change. + 5 or greater bullish. -5 or less, bearish. VIX % change 5 day m.a. +3.0 or above bullish, -3.0 or below, bearish. Advances minus declines three day m.a.( +500 is bearish. – 500 is bullish). Supply Demand 5 day m.a. (.45 or below is a positive. .80 or above is a negative). Trading Index (TRIN) 1.40 or above bullish. No level for bearish.
No guarantees are made. Traders can and do lose money. The publisher may take positions in recommended securities.


