
Todd Market Forecast for Thursday April 27, 2017 Available Mon- Friday after 6:00 P.M. Eastern, 3:00 Pacific.
DOW + 6 on flat breadth
NASDAQ COMP + 24 on 250 net declines
SHORT TERM TREND Bullish
INTERMEDIATE TERM Bullish
STOCKS: The stock market keeps inching higher mainly on better than expected profits, but we didn’t like the internals. The NASDAQ was up nicely, but breadth was lacking.
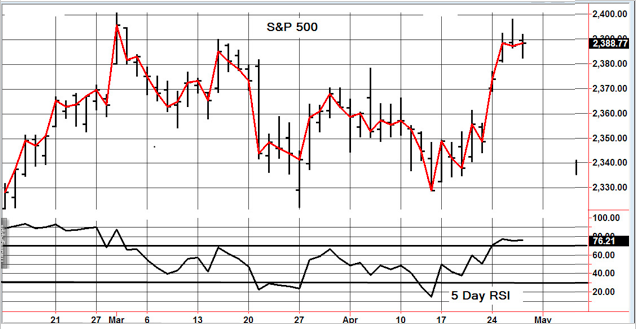
Also, the S&P 500 is in a resistance zone. Let’s see how this pans out.
GOLD: Gold was flat. Not much to report here.
CHART The S&P 500 is hesitating near all time highs. I see no reason to issue a short term sell, but I really don’t want to recommend a trading position.

BOTTOM LINE: (Trading)
Our intermediate term system is on a buy.
System 7 We are in cash stay on the sidelines for now.
System 8 We are in cash. Stay there.
System 9 We are in cash. Stay there.
NEWS AND FUNDAMENTALS: Not available
INTERESTING STUFF I can’t change the direction of the wind, but I can adjust my sails to always reach my destination. —–Jimmy Dean
TORONTO EXCHANGE: Toronto was down 143.
BONDS: Bonds were flat.
THE REST: The dollar almost unchanged. Silver was lower. Crude oil had a small bounce.
Bonds –Bullish as of April 3.
U.S. dollar -Change to bearish as of today April 25.
Euro — Change to bullish as of today April 25.
Gold —-Bearish as of April 19.
Silver—- Bearish as of April 19.
Crude oil —- Bearish as of April 18.
Toronto Stock Exchange—- Bullish from January 22, 2016
We are on a long term buy signal for the markets of the U.S., Canada, Britain, Germany and France.
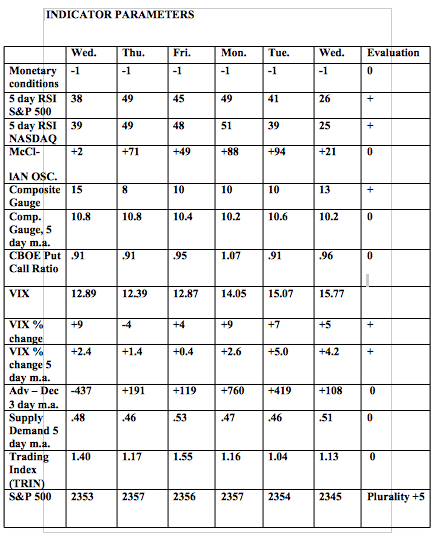
Monetary conditions (+2 means the Fed is actively dropping rates; +1 means a bias toward easing. 0 means neutral, -1 means a bias toward tightening, -2 means actively raising rates). RSI (30 or below is oversold, 80 or above is overbought). McClellan Oscillator ( minus 100 is oversold. Plus 100 is overbought). Composite Gauge (5 or below is negative, 13 or above is positive). Composite Gauge five day m.a. (8.0 or below is overbought. 13.0 or above is oversold). CBOE Put Call Ratio ( .80 or below is a negative. 1.00 or above is a positive). Volatility Index, VIX (low teens bearish, high twenties bullish), VIX % single day change. + 5 or greater bullish. -5 or less, bearish. VIX % change 5 day m.a. +3.0 or above bullish, -3.0 or below, bearish. Advances minus declines three day m.a.( +500 is bearish. – 500 is bullish). Supply Demand 5 day m.a. (.45 or below is a positive. .80 or above is a negative). Trading Index (TRIN) 1.40 or above bullish. No level for bearish.
No guarantees are made. Traders can and do lose money. The publisher may take positions in recommended securities.


