

3:00pm PST Monday May 8, 2017
DOW + 5 on 350 net declines
NASDAQ COMP + 2 on 350 net declines
SHORT TERM TREND Bearish
INTERMEDIATE TERM Bullish
STOCKS: The markets got what they wanted in the French election, but it was discounted last week. Today was sell the news.
The market is quite overbought by many measures. That by itself would not render a short term sell signal, but when you consider the underlying breadth, it makes us a bit cautious. We cover this more in the chart section below.
Any multi day retreat from current levels should provide an opportunity. The intermediate trend remains quite positive.
GOLD: Gold was flat. Not much happening here, but it is oversold.
CHART The S&P has been up 5 out of the past 7 days, but breadth has been down 5 out of the past 7 days. There are no guarantees in this business, but that is normally a short term negative. Sorry to use the same chart so often lately, but it’s the most important consideration currently.

BOTTOM LINE: (Trading)
Our intermediate term system is on a buy.
System 7 We are in cash stay on the sidelines for now.
System 8 We are in cash. Stay there.
System 9 We are in cash. Stay there.
NEWS AND FUNDAMENTALS: There were no important economic releases on Monday. I couldn’t access my source for Tuesday.
TORONTO EXCHANGE: Toronto gained 70.
BONDS: Bonds made another low.
THE REST: The dollar had a sharp rebound. Silver was flat. Crude oil managed a small gain.
Bonds –Bearish as of May 1.
U.S. dollar -Bearish as of May 4.
Euro — Bullish as of May 4.
Gold —-Bearish as of April 19.
Silver—- Bearish as of April 19.
Crude oil —- Move to bullish as of today May 5.
Toronto Stock Exchange—- Bullish from January 22, 2016
We are on a long term buy signal for the markets of the U.S., Canada, Britain, Germany and France. INDICATOR PARAMETERS
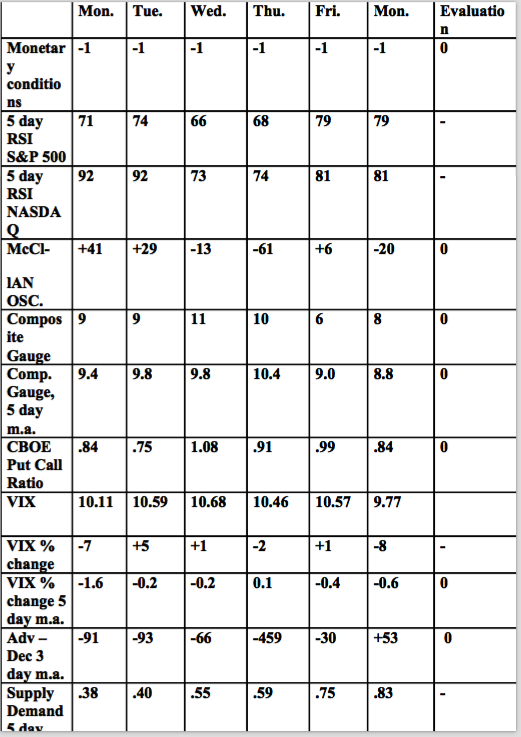
Monetary conditions (+2 means the Fed is actively dropping rates; +1 means a bias toward easing. 0 means neutral, -1 means a bias toward tightening, -2 means actively raising rates). RSI (30 or below is oversold, 80 or above is overbought). McClellan Oscillator ( minus 100 is oversold. Plus 100 is overbought). Composite Gauge (5 or below is negative, 13 or above is positive). Composite Gauge five day m.a. (8.0 or below is overbought. 13.0 or above is oversold). CBOE Put Call Ratio ( .80 or below is a negative. 1.00 or above is a positive). Volatility Index, VIX (low teens bearish, high twenties bullish), VIX % single day change. + 5 or greater bullish. -5 or less, bearish. VIX % change 5 day m.a. +3.0 or above bullish, -3.0 or below, bearish. Advances minus declines three day m.a.( +500 is bearish. – 500 is bullish). Supply Demand 5 day m.a. (.45 or below is a positive. .80 or above is a negative). Trading Index (TRIN) 1.40 or above bullish. No level for bearish.
No guarantees are made. Traders can and do lose money. The publisher may take positions in recommended securities.


