
Tuesday January 16, 2018 3:00pm Pacific.
DOW – 10 on 968 net declines
NASDAQ COMP – 37 on 1002 net declines
SHORT TERM TREND Bullish
INTERMEDIATE TERM Bullish
STOCKS: Today we had a reversal day on relatively high volume. The Dow was up 282 points shortly after the opening and then gave it all back and then some.
That type of activity can mark a significant top, but not normally. Usually it’s just a temporary interruption in the current trend. The extreme overbought condition was most likely the culprit. It would actually be good to have a multi day retreat, but I doubt we’ll get it.
GOLD: Gold was up $4. Another new low for the greenback helped push up the yellow metal.
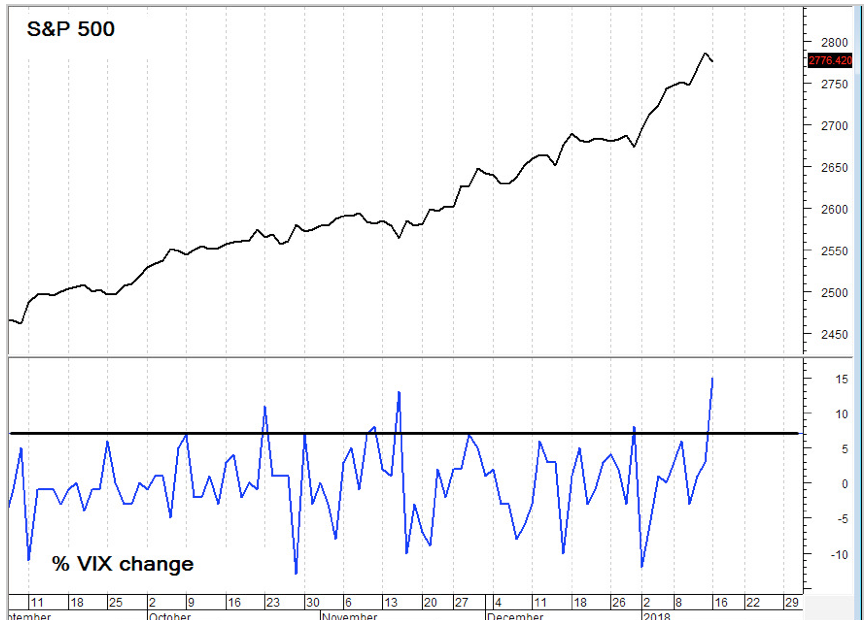
CHART: The Volatility index (VIX) moved up 15% today. Any move of over 7% has a tendency to foreshadow near term strength.

BOTTOM LINE: (Trading)
Our intermediate term system is on a buy.
System 7 We are long the SSO from 110.59. Keep your stop at 115.59
System 9 On a buy signal from Dec. 29.
NEWS AND FUNDAMENTALS: There were no important releases on Tuesday. On Wednesday we get industrial production, the housing market index and the Fed Beige Book.
INTERESTING STUFF: Reason obeys itself; and ignorance submits to whatever is dictated to it. ——Thomas Paine
TORONTO EXCHANGE: Toronto lost 73.
BONDS: Bonds were higher.
THE REST: The dollar keeps sinking. Crude oil lost ground.
Bonds –Bearish as of Jan. 9.
U.S. dollar – Change to bearish as of Jan 12.
Euro — Change to bullish as of Jan 12.
Gold —-Change to bullish as of Jan 12.
Silver—- Change to bullish as of Jan 12.
Crude oil —-Bullish as of Dec. 26.
Toronto Stock Exchange—- Bullish as of September 20, 2017.
We are on a long term buy signal for the markets of the U.S., Canada, Britain, Germany and France.

Monetary conditions (+2 means the Fed is actively dropping rates; +1 means a bias toward easing. 0 means neutral, -1 means a bias toward tightening, -2 means actively raising rates). RSI (30 or below is oversold, 80 or above is overbought). McClellan Oscillator ( minus 100 is oversold. Plus 100 is overbought). Composite Gauge (5 or below is negative, 13 or above is positive). Composite Gauge five day m.a. (8.0 or below is overbought. 13.0 or above is oversold). CBOE Put Call Ratio ( .80 or below is a negative. 1.00 or above is a positive). Volatility Index, VIX (low teens bearish, high twenties bullish), VIX % single day change. + 5 or greater bullish. -5 or less, bearish. VIX % change 5 day m.a. +3.0 or above bullish, -3.0 or below, bearish. Advances minus declines three day m.a.( +500 is bearish. – 500 is bullish). Supply Demand 5 day m.a. (.45 or below is a positive. .80 or above is a negative). Trading Index (TRIN) 1.40 or above bullish. No level for bearish.
No guarantees are made. Traders can and do lose money. The publisher may take positions in recommended securities.


