

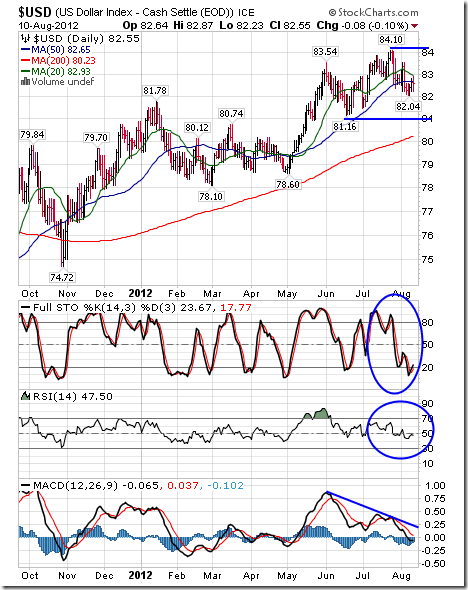
The U.S. Dollar Index added 0.17 (0.21%) last week. Intermediate trend is up. Support is at 81.16 and resistance is at 84.10. The Dollar remains above its 200 day moving average and below its 20 and 50 day moving averages. Short term momentum indicators are trending down.
Ed Note: Don’s Monday Site is well worth visiting HERE

Economic News This Week
July Producer Prices to be released on Tuesday at 8:30 AM EDT is expected to increase 0.2% versus a gain of 0.1% in June. Core PPI is expected to increase 0.2% versus a gain of 0.2% in June.
July Retail Sales to be released on Tuesday at 8:30 AM EDT are expected to increase 0.3% versus a drop of 0.5% in June. Ex autos, July Retail Sales are expected to improve 0.4% versus a decline of 0.4% in June.
The August Empire State Manufacturing Index to be released on Wednesday at 8:30 AM EDT is expected to slip to 7.2 from 7.4 in July.
July Consumer Prices to be released on Wednesday at 8:30 AM EDT are expected to increase 0.2% versus no change in June.
July Industrial Production to be released on Wednesday at 9:15 AM EDT is expected to increase 0.5% versus a gain of 0.4% in June. July Capacity Utilization is expected to increase to 79.2 from 78.9 in June.
July Housing Starts to be released on Thursday at 8:30 AM EDT are expected to slip to 752,000 from 760,000 in June.
August Philadelphia Fed to be released on Thursday at 10:00 AM EDT is expected to improve to -4.0 from -12.9 in July.
August Michigan Consumer Sentiment to be released on Friday at 9:55 AM EDT is expected to slip to 72.2 from 72.3 in July.
July Leading Indicators to be released on Friday at 10:00 AM EDT are expected to increase 0.2% versus a 0.3% decline in June.
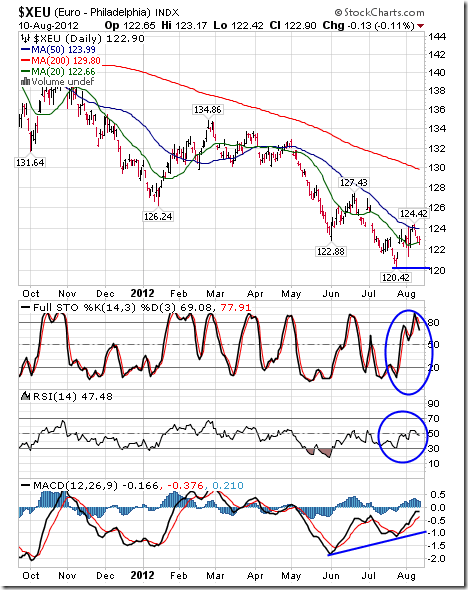
The Euro fell 0.87 (0.70%) last week. Intermediate trend is down. Support is at 120.42. The Euro remains below its 50 and 200 day moving averages and above is 20 day moving average. Short term momentum indicators are trending higher.
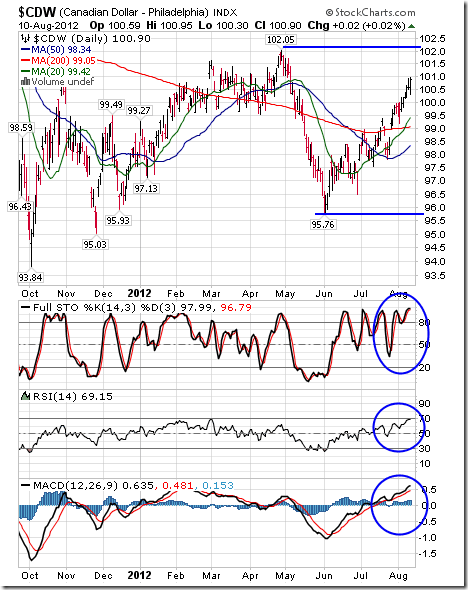
The Canadian Dollar added 1.03 cents U.S. (1.03%) last week. Intermediate trend is neutral. Support is at 95.76 and resistance is at 102.05. The Canuck Buck remains above its 20, 50 and 200 day moving averages. Short term momentum indicators are overbought, but have yet to show signs of peaking.
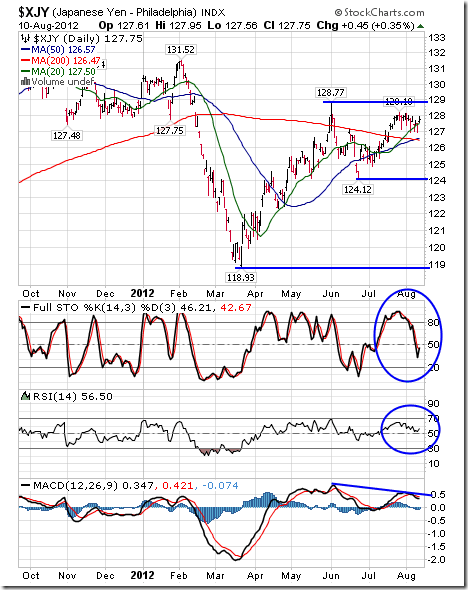
The Japanese Yen added 0.45 (0.35%) last week. Intermediate trend is down. Support is at 124.12 and resistance is at 128.77. The Yen remains above its 20, 50 and 200 day moving averages. Short term momentum indicators are trending down.
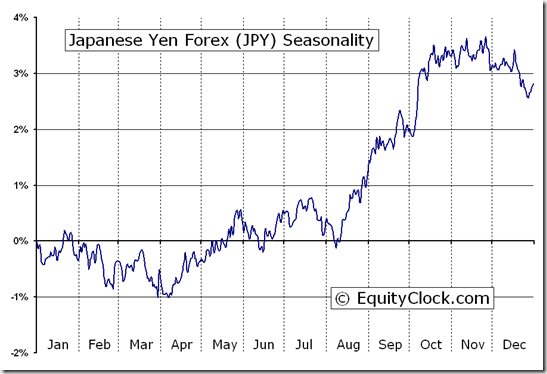
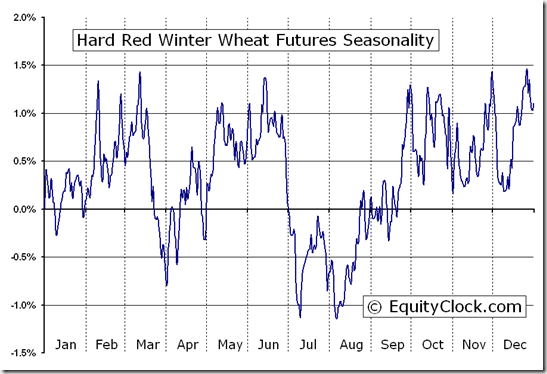
Seasonality refers to particular time frames when stocks/sectors/indices are subjected to and influenced by recurring tendencies that produce patterns that are apparent in the investment valuation. Tendencies can range from weather events (temperature in winter vs. summer, probability of inclement conditions, etc.) to calendar events (quarterly reporting expectations, announcements, etc.). The key is that the tendency is recurring and provides a sustainable probability of performing in a manner consistent to previous results.
Identified below are the periods of seasonal strength for each market segment, as identified by Brooke Thackray. Each bar will indicate a buy and sell date based upon the optimal holding period for each market sector/index.


