

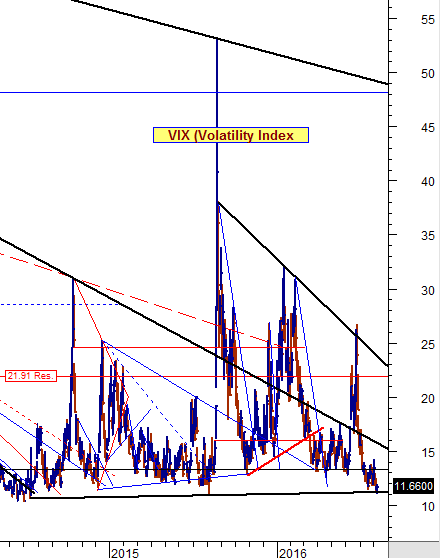
The chart below is from yesterday’s close and it show’s the VIX (Volatility Index) back to early 2014.
If you look at the chart, the VIX has a long term support line that it is finally testing.
Remember … that a higher VIX equals a lower market since they are inverse to each other. Therein comes the risk for you, so please keep an eye on the VIX.
….check the fear and greed index chart in: Wake Up and Smell the Bull Trap! (scroll down)


