
Summary
The long term CAPE/VIX ratio suggests a strong possibility of a looming US Recession in 2018 which would be an unexpected shock to the market.
The VIX going back to 2015 is in a clear ending diagonal suggesting historic lows will soon end.
The Shiller CAPE at ~30 is presently registering the third highest level in recorded US Market history. The chances of it falling in 2018 are extremely high.
The longer term VIX and CAPE charts support what the historical CAPE/VIX ratio is signalling.
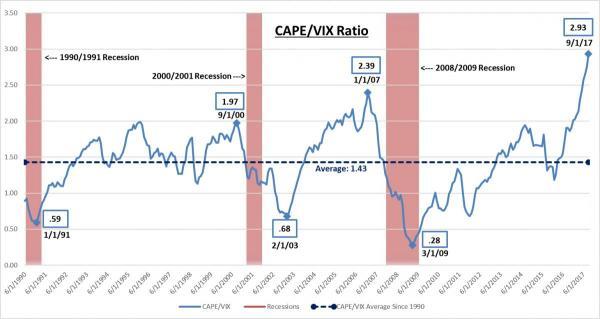
We were in the process of writing about the technical pattern in the VIX when we came across some research by Peter Schiff of Euro Pacific Capitalillustrating the historical correlation of the CAPE/VIX Ratio to US Recessions go back to 1990. We have been warning about a unexpected US Recession scare coming in 2018.

A fairly reliable technical indicator is a megaphone topping pattern. We annotated Schiff’s chart to more visibly reflect this:


